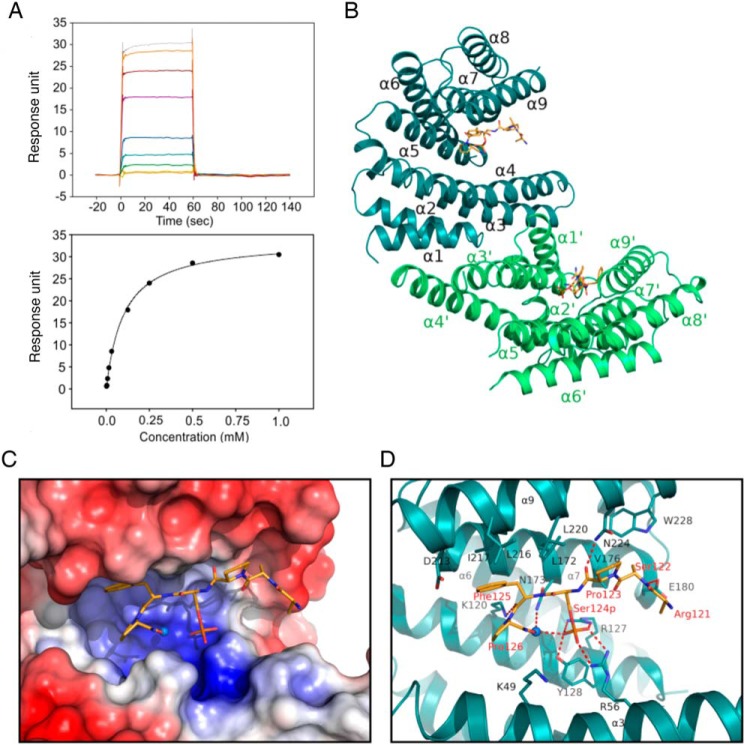
Figure 7.
Interaction of TBC1D7 phosphopeptide with 14-3-3ζ. A, surface plasmon resonance measurement of a TBC1D7 phosphopeptide with 14-3-3. The sensorgram (top) shows the response unit when flowing peptide of increasing concentrations over a CM5 chip immobilized with 14-3-3 protein. The response was fitted to a one-site binding model (bottom) and shows a binding affinity of 102 μm. B, structure of 14-3-3 dimer with two TBC1D7 peptides. C, surface electrostatic potential map of the peptide binding groove of 14-3-3 at −5.0 kT/e to +5.0 kT/e scale. Blue, positively charged residues; red, negatively charged residues. D, stick model of the residues involved in the interaction between TBC1D7 peptide and 14-3-3 protein. The water molecule involved in binding is shown as a sphere. Salt bridges and hydrogen bonds are indicated with red dashed lines.

