Figure 3.
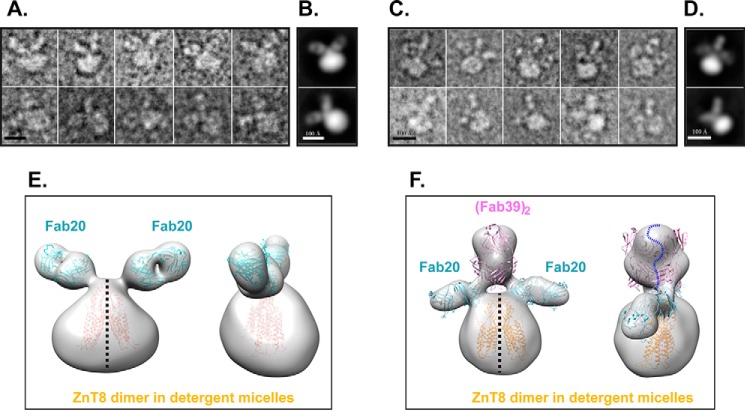
EM analysis of ZnT8–Fab complexes. A, representative raw particles of the binary complex ZnT8–(Fab20)2 in negative stain. Scale bar, 100 Å. B, representative reference-free 2D class averages of the binary complexes. C, representative raw particles of ternary complex (Fab20)2–ZnT8–(Fab39)2. D, representative reference-free 2D class averages of the ternary complexes. E, 3D map of ZnT8–(Fab20)2 in two views related by a 90° rotation around a 2-fold axis perpendicular to the membrane plane (black dashed line). Atomic models of Fab20 (PDB code 1M71) and ZnT8 homolog (PDB code 3H90) were fitted into the low-resolution envelope and colored in cyan and yellow, respectively. F, 3D model of (Fab20)2–ZnT8–(Fab39)2 in two views docked with four Fab structures, representing two Fab20 (cyan) and two Fab39 (magenta), respectively. The ZnT8 dimer model is shown in yellow. A blue dashed curve marks the boundary between two Fab39 molecules on top in close proximity.

