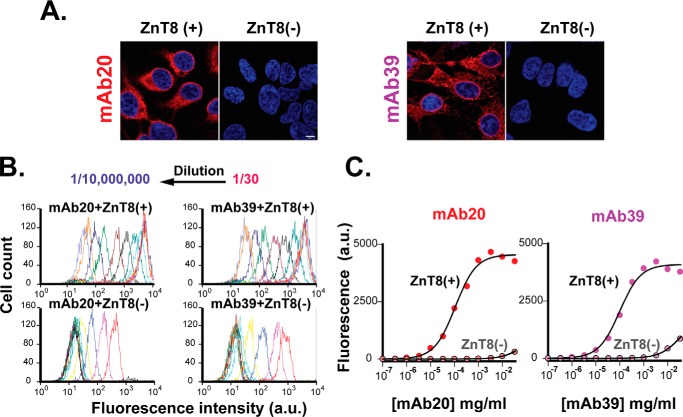
Figure 6.
mAb binding affinity. A, representative confocal microscopy images of immunofluorescence staining of fixed and saponin-permeabilized HEK293 cells with mAb20 or mAb39 staining as indicated. ZnT8(+) or ZnT8(−), HEK293 cells with or without ZnT8 overexpression. Red, mAb20 or mAb39 staining; blue, 4′,6-diamidino-2-phenylindole; scale bar, 5 μm. B, histograms of flow cytometry counting events. Arrows, leftward shifts of the histogram as a result of mAb serial dilutions. C, mAb binding to HEK293 cells with or without ZnT8 overexpression as indicated. Immunofluorescence intensities of mAb20 or mAb39 labeling in serial dilutions were obtained from B. Solid lines, least-squares fits of the binding data to a one-component binding process. a.u., arbitrary units.

