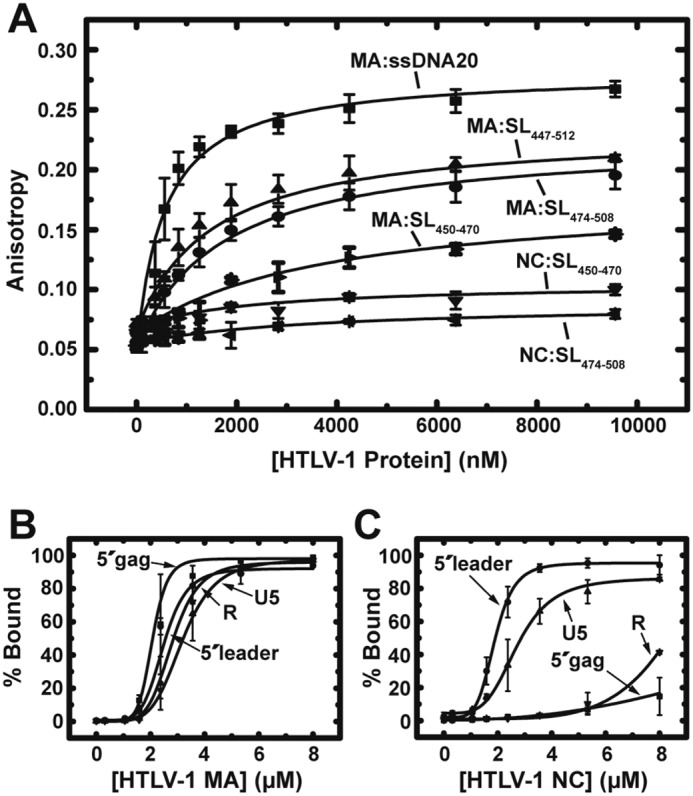
Figure 2.

Binding assays with HTLV-1 MA and NC. A, results of FA binding assays wherein 20 nm fluorescently labeled ssDNA20 or RNA was titrated with increasing concentrations of HTLV-1 MA or NC proteins. The averages of three experiments with standard deviations are shown. B and C, results of EMSA binding studies investigating HTLV-1 MA (B) and NC (C) binding interactions with the 5′ leader. The percentage of bound RNA is plotted as a function of protein concentration with curves fit to the Hill equation (96). Error bars represent standard deviations from two independent experiments.
