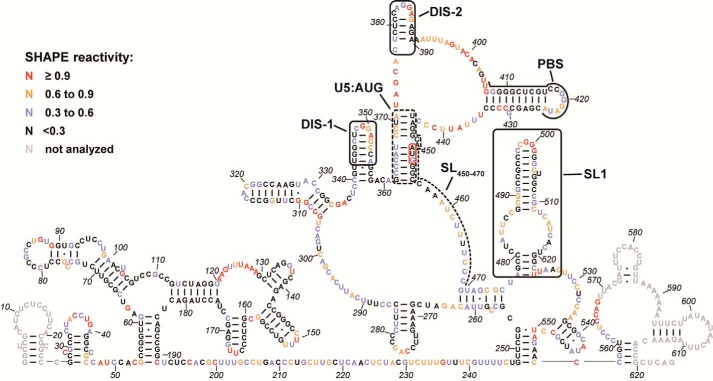
Figure 3.
SHAPE analysis of HTLV-1 5′ leader RNA. The secondary structure model was predicted by incorporating the averaged NMIA reactivities for each nt from three to seven independent experiments as pseudo free-energy constraints in RNAstructure (99, 100). Nucleotides are colored according to SHAPE reactivity as indicated in the key. The PBS region, a previously identified DIS (DIS-2) (40, 47), a newly identified DIS (DIS-1), SL(450–470), SL1, and the U5:AUG interaction are labeled and indicated by black boxes or lines. The AUG start codon is highlighted using a red box. Gray nt indicate regions where SHAPE data could not be accurately analyzed due to primer binding and signal distortion near the RNA ends.

