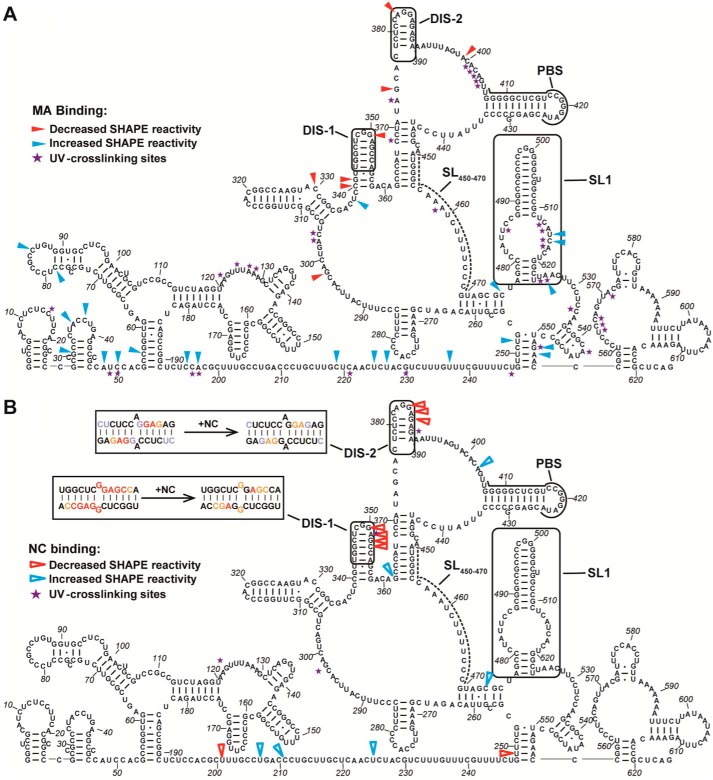
Figure 5.
Results of XL-SHAPE analysis on HTLV-1 MA (A) and NC (B) binding to the HTLV-1 5′ leader RNA. Arrows indicate sites with decreased (red) and increased (blue) NMIA reactivity upon protein binding, and violet stars indicate protein cross-linking sites. All identified sites correspond to positions with calculated reactivity changes of ≥0.3 and p < 0.05 based on an unpaired two-tail Student's t test. Experiments were performed in triplicate. Potential intermolecular dimerization of DIS-1 and DIS-2 sequences is shown in B (upper left, boxed) with SHAPE reactivity changes upon NC binding indicated (nt color scheme within the boxes is the same as in Fig. 3).

