Figure 1.
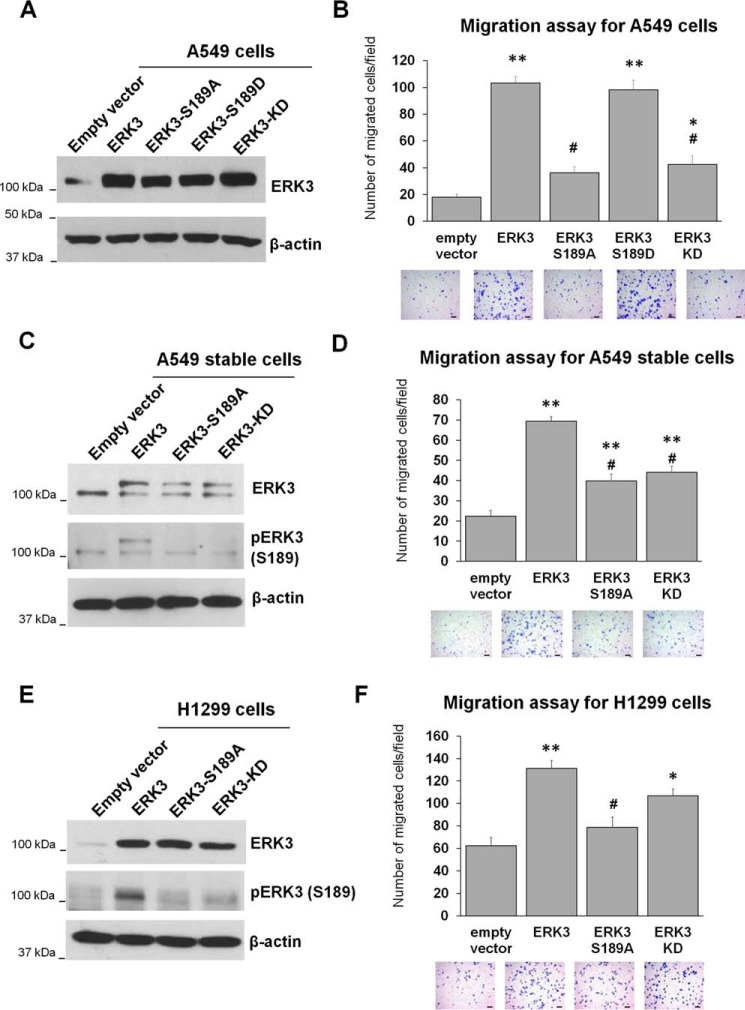
Activation loop phosphorylation is important for the migration-promoting ability of ERK3 in lung cancer cells. A and B, A549 cells were transiently transduced with lentiviruses expressing an empty vector or HA-tagged WT or mutant ERK3 (S189A, S189D, or KD). The overexpression of ERK3 was verified by Western blotting using an anti-ERK3 antibody (A), and migration was assessed by Transwell cell migration assay (B). C and D, A549 cells were stably transduced with lentiviruses expressing an empty vector, myc-ERK3, myc-ERK3-S189A, or myc-ERK3-KD. Overexpression of myc-ERK3 proteins in stable cell lines was verified by Western blotting using anti-ERK3 antibody (C). Phospho-ERK3 (Ser189) was analyzed by immunoprecipitation of ERK3 using an ERK3 Ab, followed by Western blotting using anti-phospho-ERK3 (Ser189) antibody. In both the ERK3 and pERK3 (Ser189) immunoblots, the lower bands represent endogenous ERK3 (or endogenous phospho-ERK3-Ser189), whereas the higher bands represent the overexpressed myc6-tagged ERK3 (or phospho-myc6-ERK3-Ser189) proteins. Cell migration ability was assessed by Transwell migration assay (D). E and F, H1299 cells were transiently transfected with an empty vector or HA-tagged WT or mutant ERK3, as indicated. Two days post-transfection, the cells were lysed and analyzed by Western blotting using an anti-ERK3 antibody and an anti-phospho-ERK3 (Ser189) antibody (E). The migration ability of the cells was determined by Transwell migration assay (F). The quantitated migration ability is presented as the number of migrated cells per field. Values in the bar graphs represent mean ± S.E. (n ≥ 6 fields). **, p < 0.001 (significantly different compared with empty vector); *, p < 0.05 (significantly different compared with empty vector); #, p < 0.001 (significantly different compared with ERK3); one-way ANOVA. Representative images of migrated cells stained with crystal violet are shown below each bar graph. Scale bars, 100 μm.

