Figure 3.
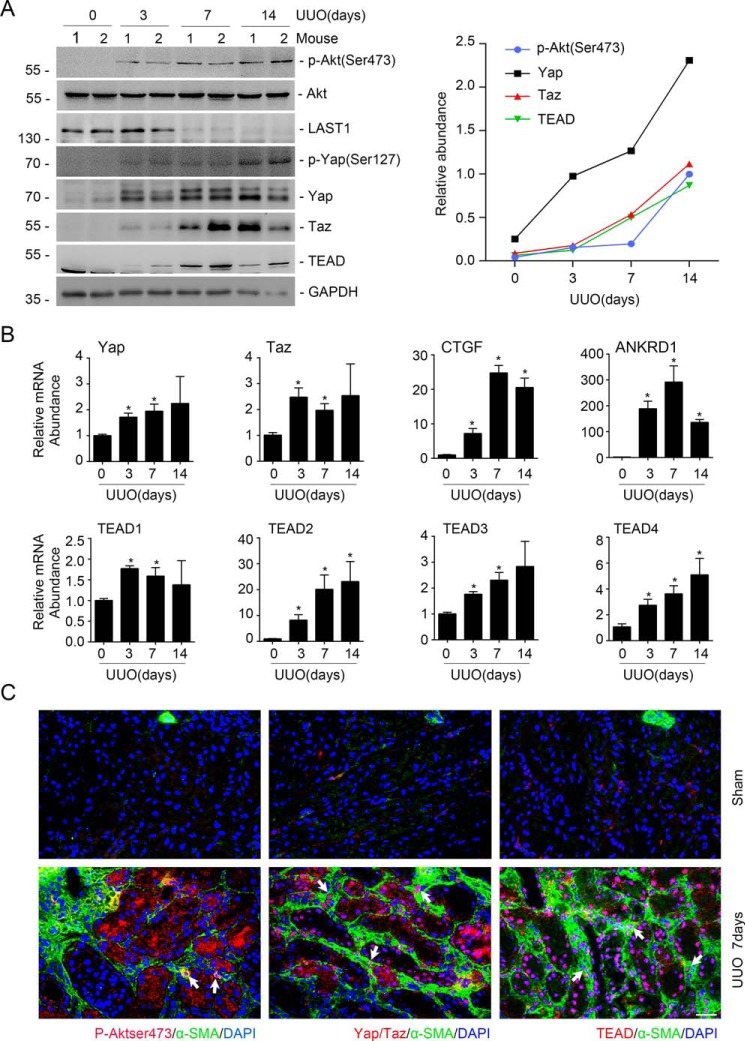
Co-activation of mTORC2 and Yap/Taz signaling in myofibroblasts from the UUO kidneys. A, Western blot assay (left) and semiquantitative analysis (right) showing the induction of p-Akt (Ser-473), p-Yap (Ser-127), Yap, Taz, and TEAD in the UUO kidneys. B, real-time RT-PCR analysis showing the mRNA abundance for Yap, Taz, CTGF, ANKRD1, and TEAD1–4 in the UUO kidneys. *, p < 0.05 compared with sham control (n = 3–4). C, representative images showing the induction for p-Akt (Ser-473), Yap/Taz, and TEAD in myofibroblasts from the UUO kidneys at day 7 after surgery. White arrows, myofibroblasts with the induction of p-Akt (Ser-473), Yap/Taz, and TEAD, respectively. Scale bar, 20 μm. Error bars, S.E.

