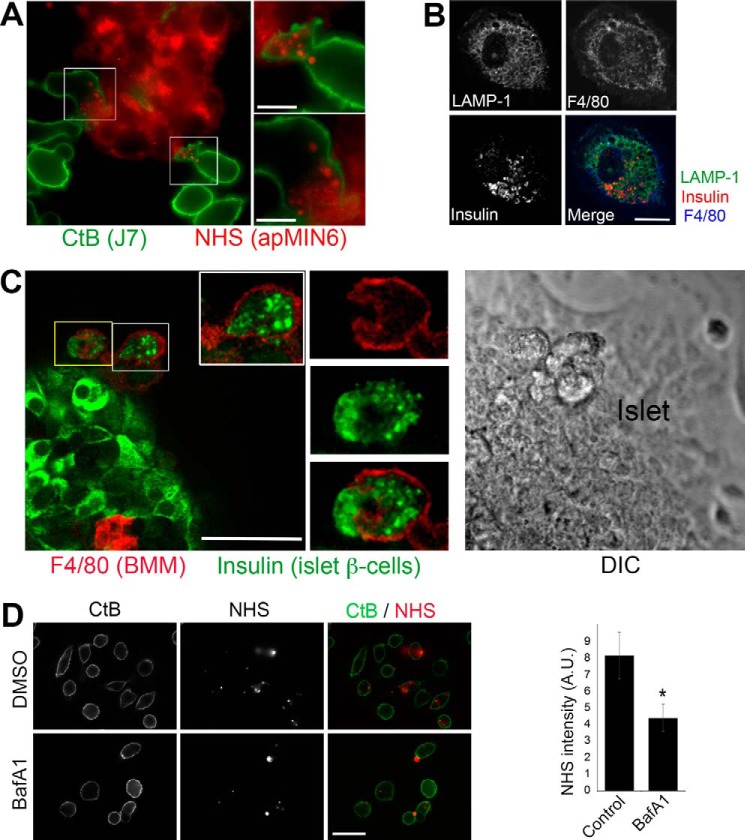
Figure 1.
Experimental models for studying β-cell efferocytosis in vitro. A, co-culture of J7 with apMIN6. apMIN6 cells were labeled with NHS (red) before incubation with J7 cells overnight, followed by CtB labeling (green) and wide-field microscopy. B, primary islet macrophages from STZ-treated apoptotic islets. Single islets isolated from STZ-treated mice were seeded individually in imaging dishes and stained with F4/80, insulin, and LAMP-1 antibodies. Shown here is a confocal image of an islet macrophage that migrated out of the islet. C, interaction of BMMs with apoptotic islets. Isolated islets were cultured for 2 weeks to induce apoptosis before BMMs were added for 24 h. The co-culture was stained with F4/80 and insulin antibodies, and imaged by confocal microscopy. The differential interference contrast (DIC) panel shows the imaged portion of the islet. D, verification that NHS-labeled apoptotic bodies were phagocytosed by macrophages. Floating apMIN6 cells were labeled with NHS (red) before incubation with attached J7 cells for 2 h with or without bafilomycin A1 (BafA1) followed by extensive rinsing, and imaged by wide-field microscopy. CtB (green) was used to label J7 plasma membrane. NHS fluorescence inside CtB was quantified from 60 cells. *, p < 0.05. A.U., arbitrary units. Scale bars: 10 μm (A and B), 50 μm (C and D).

