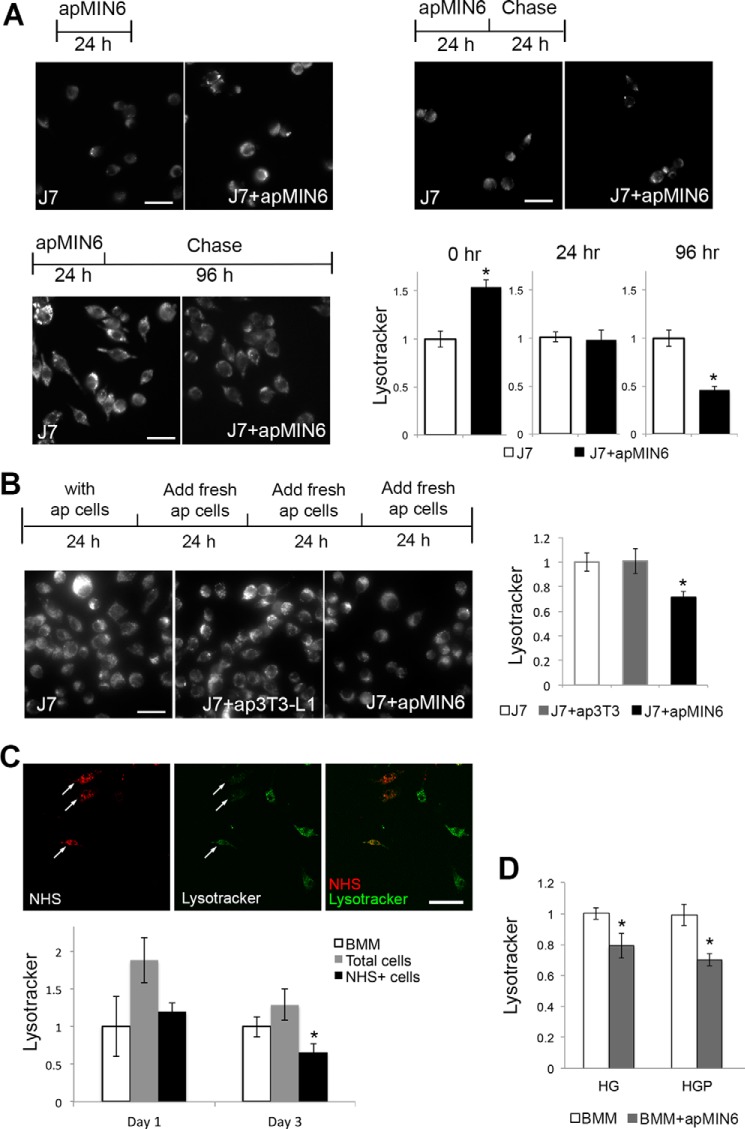
Figure 3.
LysoTracker staining was decreased by phagocytosis of apMIN6 cells. A, J7 cells were incubated with apMIN6 for 24 h, chased for various lengths of time, labeled with LysoTracker and imaged by wide-field microscopy. LysoTracker fluorescence per cell from 16 imaging fields was quantified. B, J7 cells were pulsed with fresh apMIN6 every 24 h for 96 h before being labeled by LysoTracker, with apoptotic 3T3-L1 (ap3T3) used as a control for general efferocytosis of noninsulin containing cells. n = 12 imaging fields. C, BMMs were incubated with NHS-labeled apMIN6 for 24 h and chased for 3 days before LysoTracker fluorescence was measured from all cells (gray bars) or NHS-positive cells (black bars). Arrows point to NHS-positive BMMs indicating efferocytosis. At least 20 cells were used for each condition. D, BMMs were incubated with apMIN6 for 24 h and chased for 3 days in HG or HGP medium before LysoTracker fluorescence was measured from all cells. n = 9 imaging fields. All measurement was normalized to that obtained in J7 or BMMs alone (control). *, p < 0.05 versus control. Scale bars, 50 μm.

