Figure 4.
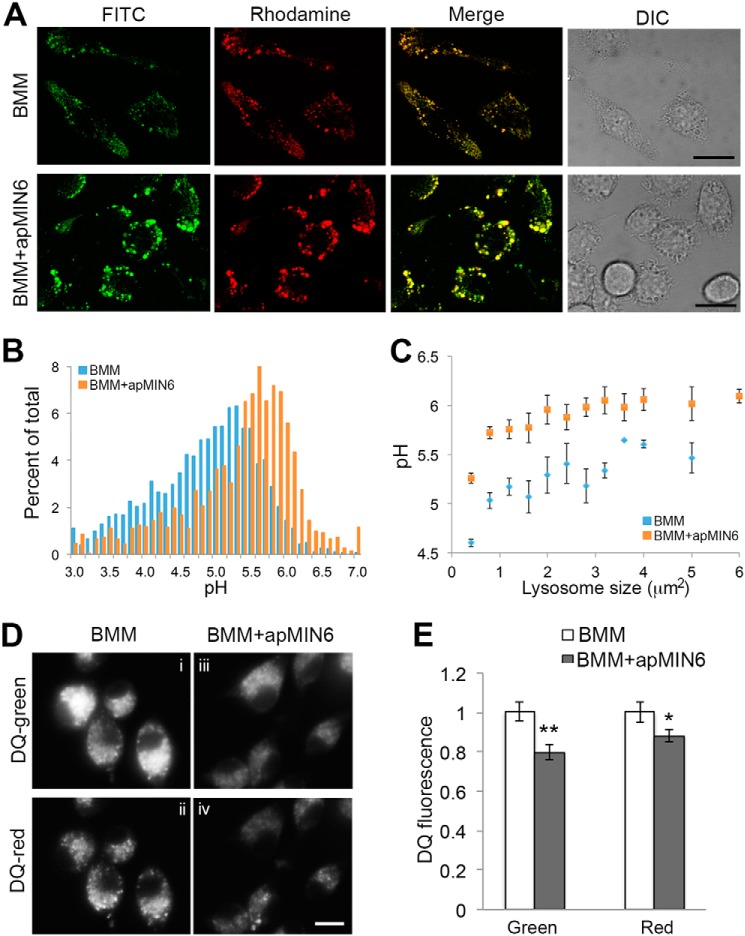
Lysosomal dysfunction as a result of phagocytosis of apMIN6. A–C, lysosomal pH was measured using FITC-rhodamine dextran in living BMMs by confocal microscopy (A), and quantified by the ratio of FITC (green) to rhodamine (red) fluorescence in each individual lysosome (B and C). B, histogram of lysosomal pH values from BMMs alone and BMMs exposed to apMIN6. C, lysosomes were pooled and an average of their pH values are presented as a function of lysosome sizes. D and E, the proteolytic capacity of the lysosomes was measured using a fluorogenic substrate for lysosomal proteases, DQ-ovalbumin (DQ), whose green fluorescence increased dramatically upon hydrolysis by proteases. Concentrated DQ fragments gave rise to red fluorescence emission. BMMs were treated with HG prior to loading with DQ. DQ fluorescence per cell was quantified from 12 imaging fields. *, p < 0.05; **, p < 0.01. Scale bars, 20 μm.

