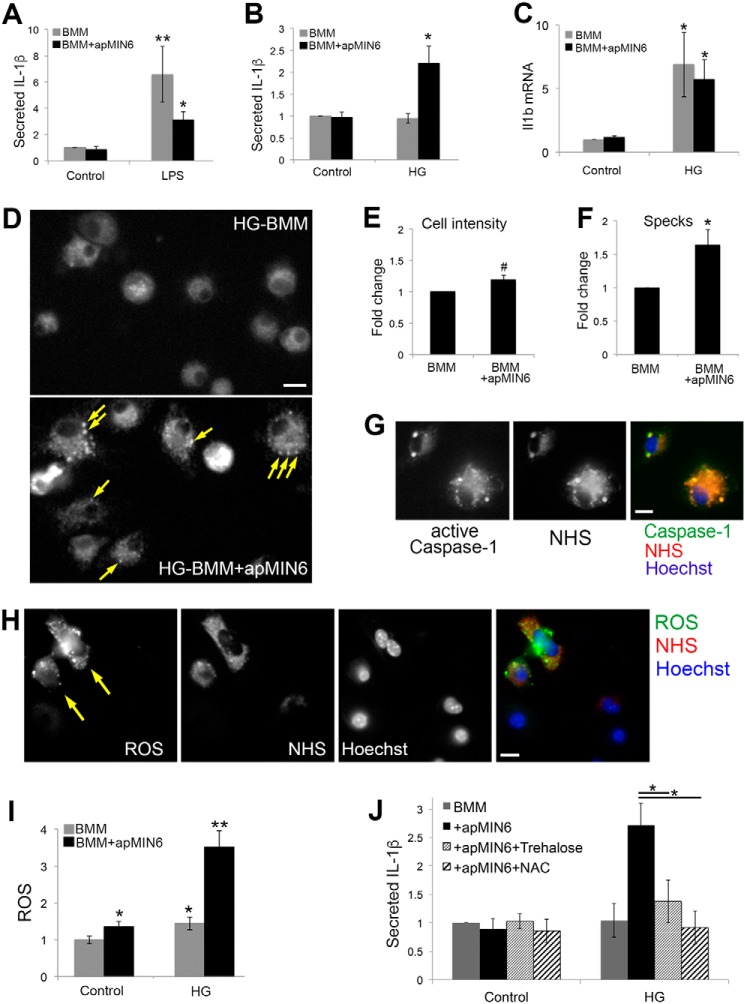
Figure 6.
ROS and inflammation induced by β-cell efferocytosis and high glucose. A–C, BMMs kept in control (A) or HG (B and C) medium were cultured alone or overnight with apMIN6, and incubated for another 24 h with LPS (A) or in HG (B and C). A and B, medium was collected for ELISA of secreted IL-1β. C, expression of Il1b was measured by quantitative RT-PCR. **, p < 0.01 by Mann-Whitney Rank Sum Test; *, p < 0.05 by Student's t test. D–G, caspase-1 activation was visualized using FAM-FLICA. D, HG-BMMs with or without apMIN6 efferocytosis were labeled with FAM-FLICA and imaged by wide-field microscopy. Arrows point to the specks where active caspase-1 was concentrated. E and F, total fluorescence and number of specks per cell was measured from 10 imaging fields, respectively, from 10 imaging fields. G, apMIN6 cells were labeled with NHS before being added to HG-BMMs. Scale bar, 10 μm. H, HG-BMMs were incubated with NHS-apMIN6 cells and labeled with carboxy-H2DFFDA to measure ROS and Hoechst to stain nuclei. I, BMMs kept in control or HG medium were cultured alone or overnight with apMIN6, and labeled with carboxy-H2DFFDA and Hoechst. ROS was measured as carboxy-H2DFFDA fluorescence per cell and normalized to that from control BMMs. n = 12 imaging fields. Bar, 20 μm. *, p < 0.05; **, p < 0.01; #, not significant by Student's t test. J, BMMs in control or HG medium were cultured overnight alone or with apMIN6 in the presence or absence of 10 mm trehalose or 0.5 mm NAC. Medium was collected after 24 h for ELISA of secreted IL-1β. *, p < 0.05 by ANOVA test.

