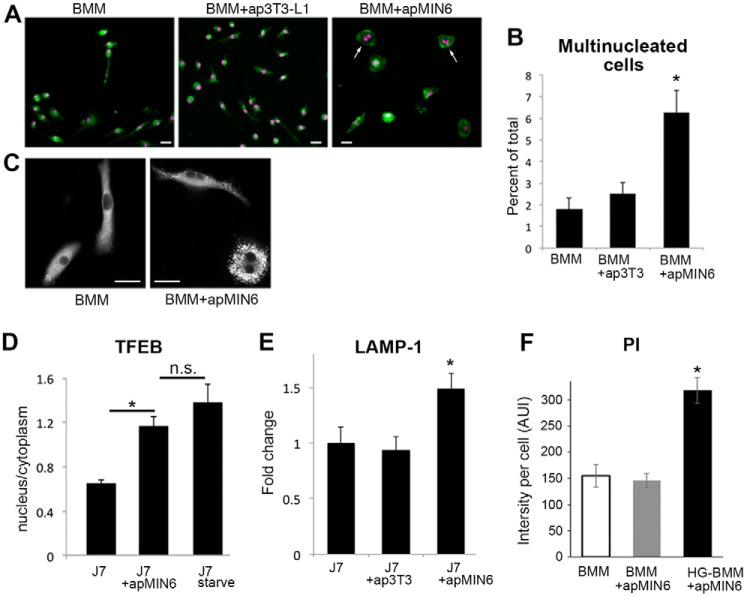
Figure 8.
Phagocytosis of apMIN6 induces cellular changes associated with inflammation. A and B, BMMs, BMMs with ap3T3-L1, and BMMs with apMIN6 were labeled with CellTracker (green) and Hoechst (purple). Bar, 20 μm. The percent of multinucleated cells (arrows) was quantified from 9 imaging fields. *, p < 0.05 versus BMMs alone. C, HG-BMMs with or without β-cell efferocytosis were labeled with LipidTOX. Bar, 20 μm. D, J7 cells with or without β-cell efferocytosis were stained with TFEB antibody. TFEB translocation was measured by the ratio of TFEB fluorescence intensity in the nucleus to that in the cytoplasm. As positive control, cells were starved for 2 h to induce TFEB translocation. n = 9 imaging fields. *, p < 0.05 versus J7 alone. n.s., not significant. E, total LAMP-1 fluorescence was quantified and normalized to cell area. Data are presented as fold-change relative to J7 cells alone. n = 12 imaging fields. *, p < 0.05 versus J7 alone. F, BMMs or HG-BMMs with or without β-cell efferocytosis were labeled with PI to measure cell death. n = 9 imaging fields. *, p < 0.05 versus BMMs alone.

