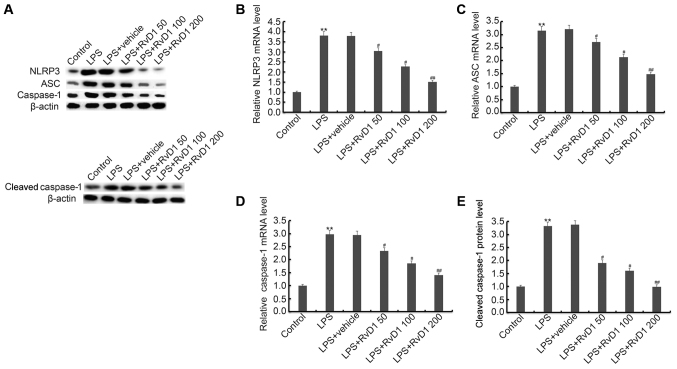
Figure 5.
(A-E) Effect of RvD1 on NLRP3 inflammasome. MG-63 cells were pretreated with different concentrations of RvD1 (50, 100, 200 nM) for 2 h, then these cells were treated with or without 1 µg/ml LPS for 48 h. Then, protein (A, E) level of NLRP3, ASC and cleaved caspase-1/caspase-1, and mRNA (B-D) levels of NLRP3, ASC and caspase-1 were detected by western blot analysis and RT-qPCR. Control, cells without any treatment; LPS, 1 µg/ml LPS treatment group; LPS + vehicle, 1 µg/ml LPS + 0.1% ethanol treatment group; LPS + RvD1 50, 1 µg/ml LPS + 50 nM RvD1 treatment group; LPS + RvD1 100, 1 µg/ml LPS + 100 nM RvD1 treatment group; LPS + RvD1 200, 1 µg/ml LPS + 200 nM RvD1 treatment group. **P<0.01 vs. Control; #P<0.05 vs. LPS; ##P<0.01 vs. LPS. RvD1, resolvin D1.

