
FIG 3.
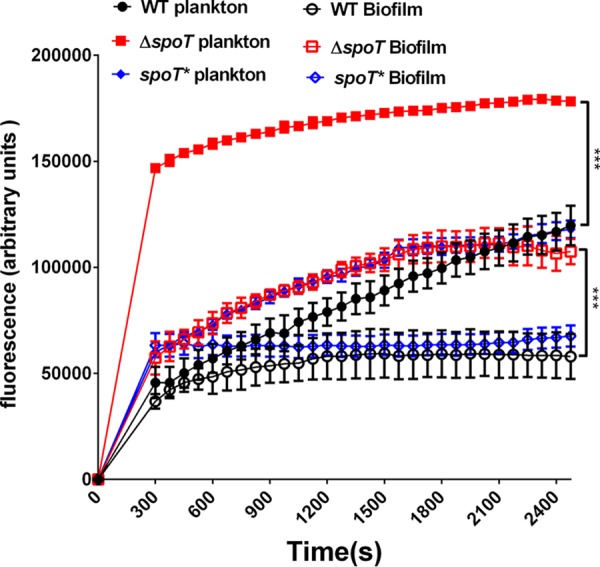
Comparison of the accumulation of Hoechst 33342 (2.5 M) in biofilm and planktonic cells of the WT, ΔspoT, and spoT*strains. The fluorescence intensity was recorded at excitation and emission wavelengths of 350 and 460 nm, respectively, over a 30-min incubation period. The data presented are the means ± standard errors of the means from three separate experiments. The paired Student's t test was performed to compare the accumulation of Hoechst 33342 between the WT and ΔspoT strains. ***, P < 0.001.