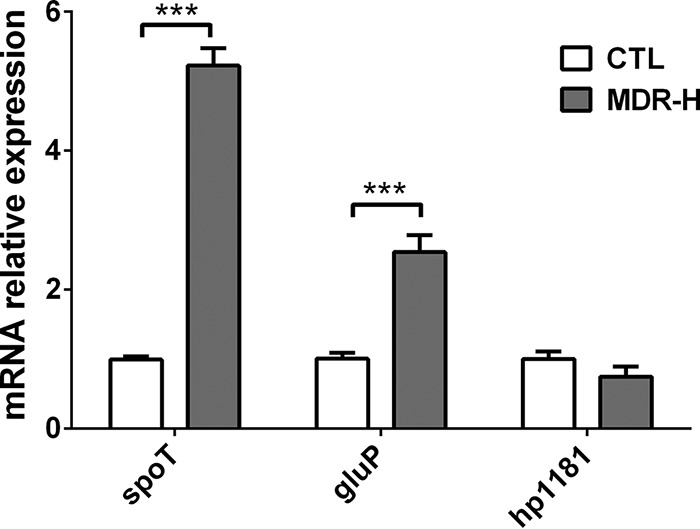
FIG 4.

qRT-PCR analysis of the mRNA levels of spoT, gluP (Hp1174), and Hp1181 in the MDR-H strain (selected artificially) compared to those in the WT. The signals were normalized to the 16S rRNA levels. Data are the means ± standard errors of the means from three independent experiments. Significance was determined by the paired Student's t test. ***, P < 0.001. CTL, control.
