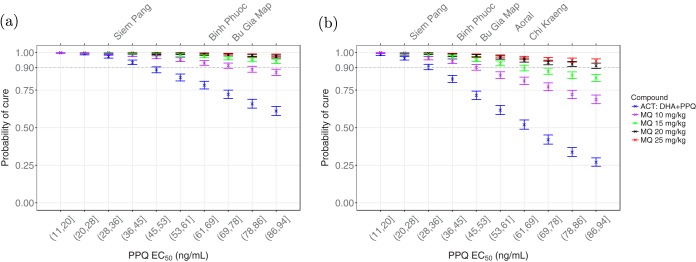
FIG 3.
The probability of cure on day 42 of follow-up when EC50 of PPQ varies over the deciles of [11 94]. (a and b) Sensitivity (a) and resistance (b) to DHA. Blue, ACT treatment (the dosing regimens of PPQ and DHA are 18.0 mg/kg and 4.0 mg/kg, respectively, on days 1, 2 and 3); purple, a 10-mg/kg (3.3 mg/kg/day for 3 days) dose of MQ is added; green, a 15-mg/kg (5 mg/kg/day for 3 days) dose of MQ is added; black, a 20-mg/kg (6.7 mg/kg/day for 3 days) dose of MQ is added; red, a 25-mg/kg (8.3 mg/kg/day for 3 days) dose of MQ is added. The top labels show the geographical regions in South-East Asia (Table 1) where DHA-PPQ cure rates equal to the corresponding simulated values have been observed. Error bars show the 95% confidence intervals from Kaplan-Meier analysis.

