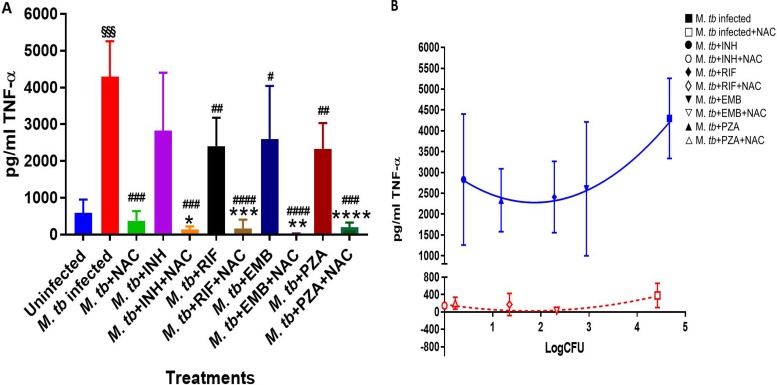
FIG 3.
TNF-α levels in M. tuberculosis-infected macrophages treated with first-line antibiotics in the presence and absence of NAC. The assay of TNF-α was performed using an ELISA Ready-Set-Go kit from eBioscience. There was a significant increase in the levels of TNF-α when macrophages were infected with M. tuberculosis. There was a significant decrease in the levels of TNF-α when macrophages were infected with M. tuberculosis and treated with NAC. Additionally, there was a significant decrease in the levels of TNF-α when M. tuberculosis-infected macrophages were treated with INH, INH plus NAC, RIF, RIF plus NAC, EMB, EMB plus NAC, and PZA plus NAC. Data represent the means ± SE from 6 trials. *, P < 0.05 when comparing the antibiotic plus NAC to the antibiotic alone or infected NAC to infected control. **, P < 0.005 when comparing the antibiotic plus NAC to the antibiotic alone or infected NAC to infected control. ***, P < 0.0005 when comparing the antibiotic plus NAC to antibiotic alone or infected NAC to infected control. ****, P < 0.00005 when comparing the antibiotic plus NAC to antibiotic alone or infected NAC to infected control. #, P < 0.05 when comparing each antibiotic category to the infected control. ##, P < 0.005 when comparing each antibiotic category to the infected control. ###, P < 0.0005 when comparing each antibiotic category to the infected control. ####, P < 0.00005 when comparing each antibiotic category to the infected control. §§§, P < 0.0005 when comparing infected control to uninfected control. (B) Correlation between TNF-α production and M. tuberculosis survival inside untreated, NAC-treated, INH-treated, INH- and NAC-treated, RIF-treated, RIF- and NAC-treated, EMB-treated, EMB- and NAC-treated, PZA-treated, and PZA- and NAC-treated macrophages.

