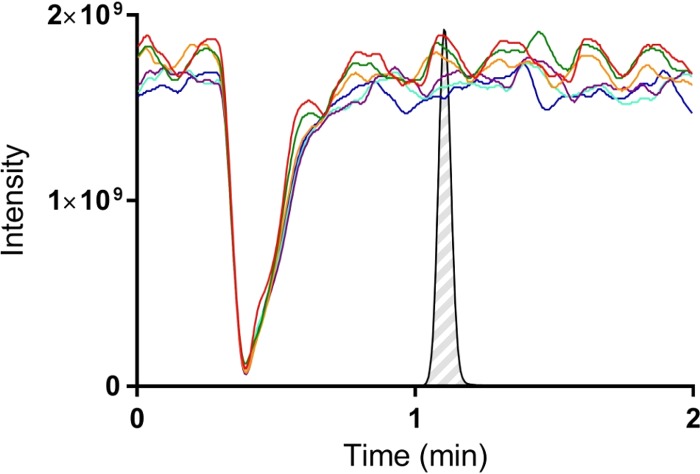
FIG 3.
Suppression-enhancement-ionization (SEI) experiment (post-column infusion). Drifts and shifts of MS/MS signal intensities of F901318 (during analysis of six extracted blank plasma samples [indicated by colored lines]). MS/MS signal intensities were plotted against time. A representative chromatogram of F901318 is shown.

