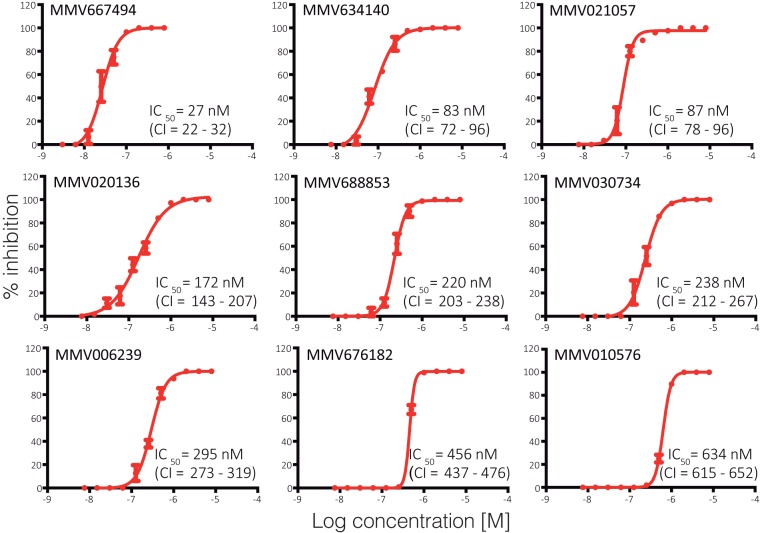
FIG 4.
Dose-response curves and determination of IC50. Indicated compounds were 2-fold serially diluted in conversion assays, in triplicates, starting from 1 μM (100% inhibition) until no inhibition was observed. The calculated IC50 and top and bottom 95% confidence intervals (CI) for each compound are indicated in the graphs. Inhibition at each dilution point is shown as means ± the SD. The results are representative of three independent experiments.

