
Figure 2.
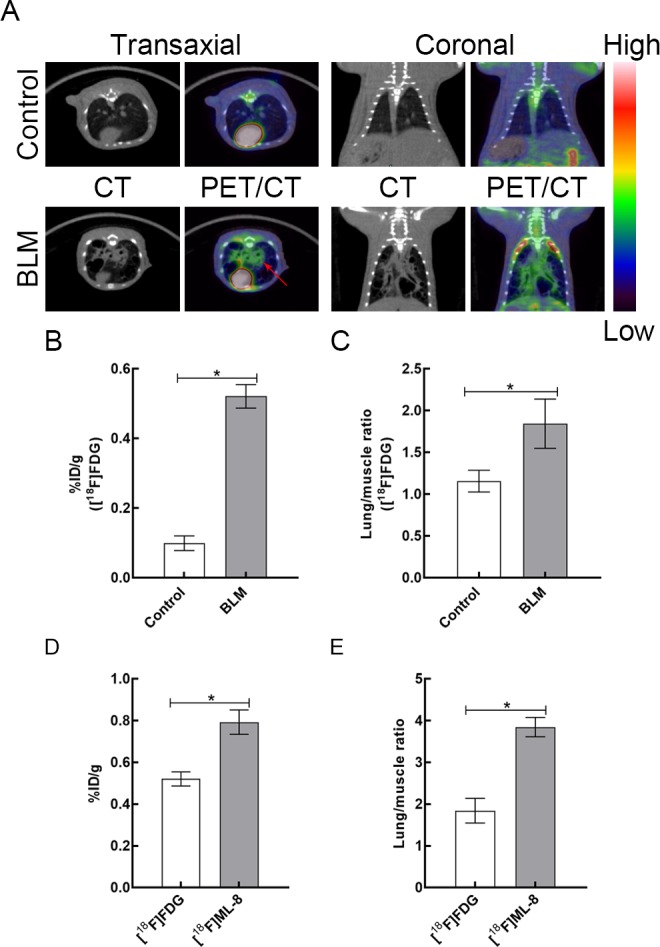
A, Representative [18F]FDG PET/CT images in control and BLM groups at day 21 after instillation. (The red arrows indicate fibrotic lung tissues.) B, The lung uptake of [18F]FDG in control and BLM groups at 1 hour after injection. C, The lung versus muscle uptake ratio of [18F]FDG in 2 groups. D, The uptake of fibrotic lung tissues between [18F]FDG and [18F]ML-8 in the BLM group. E, Bar chart shows difference in the uptake ratio (lung versus muscle) between [18F]ML-8 PET and [18F]FDG PET at day 21 after instillation. Data are reported as mean (standard deviation; N = 3 for each group).*P < .05. BLM indicates bleomycin; CT, computed tomography; [18F]FDG, 18F-fluorodeoxyglucose; [18F]ML-8; 2-(3-[18F]fluoropropyl)-2-methyl-malonic acid; PET, positron emission tomography.