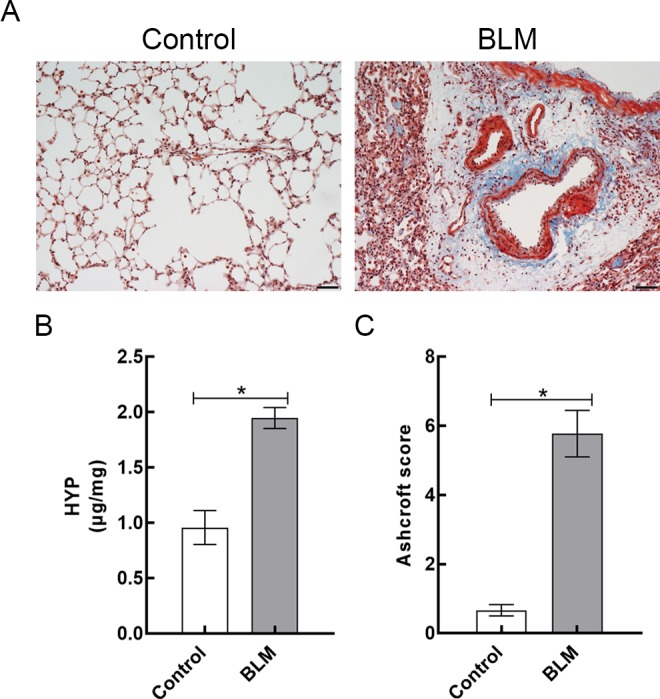
Figure 3.

A, Representative lung sections stained with Masson trichrome (magnification, × 200) of control rats and BLM-treated rats. B, Lung HYP content in control and BLM groups. C, Ashcroft scores of 2 groups were measured at day 21 after instillation. Data are reported as mean (standard deviation; N = 3 for each group). *P < .05. Scale bars = 50 µm. BLM indicates bleomycin; HYP, hydroxylproline.
