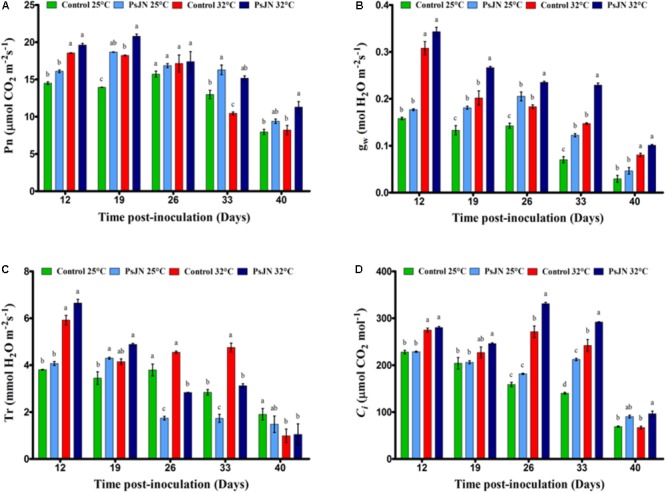
FIGURE 1.

The net photosynthetic rate, Pn (A); stomatal conductance, gs (B); transpiration rate, Tr (C); and internal CO2 concentrations, Ci (D) in leaves of mock-treated and bacterized tomato plants. Measurements were conducted at both conditions 25 and 32°C. Same letters indicate non-significant differences among all conditions. Data (mean ± SE) are averages of three independent experimental replicates, each with three plants per treatment (n = 9).
