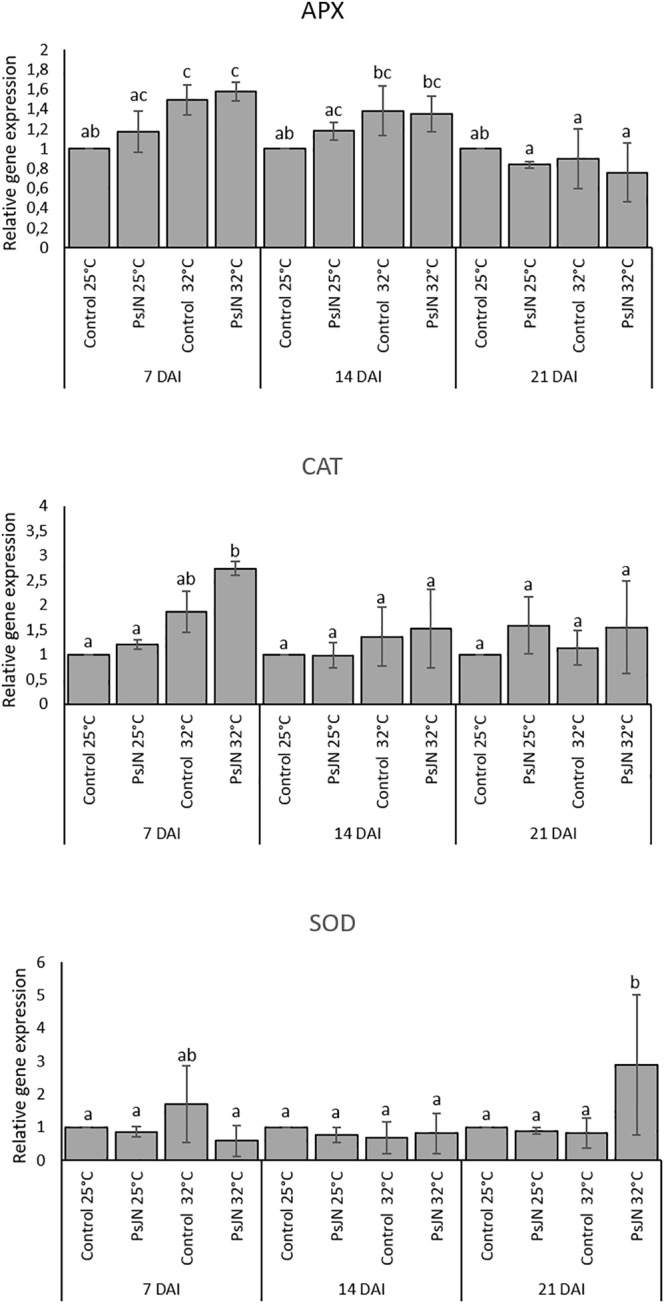
FIGURE 7.

Expression levels of APX2, CAT1, and SOD in bacterized and non-bacterized tomato under normal (25°C) and high-temperature (32°C) conditions. Same letters indicate non-significant differences among all conditions. Fold expression values are normalized against EF1a and Actin genes as controls.
