
Figure 6.
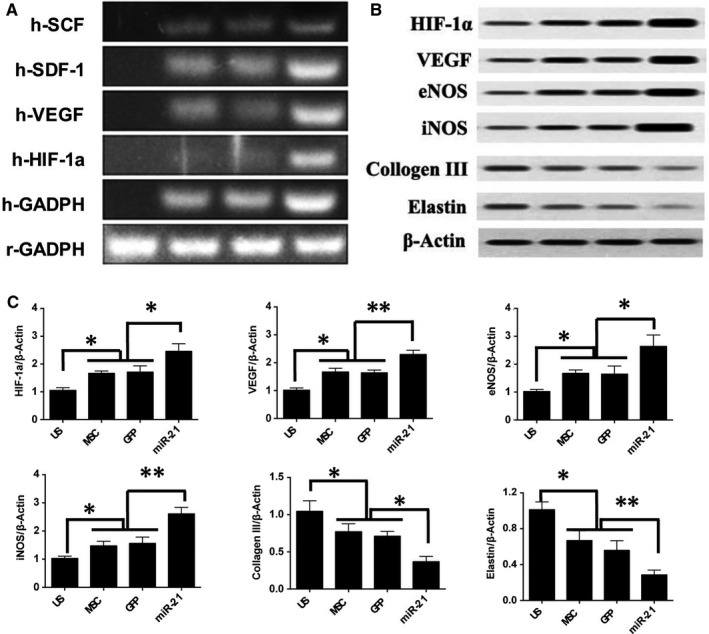
In vivo RT‐PCR and Western blotting analysis results. A, In vivo RT‐PCR measurement of the angiogenic relative genes expressions; (B) representative chemiluminescence images of blotted membranes and (C) summarized protein expression levels for HIF‐1a, VEGF, iNOS, eNOS, collagen III and elastin accordingly. *P < 0.05, **P < 0.01