
Figure 3.
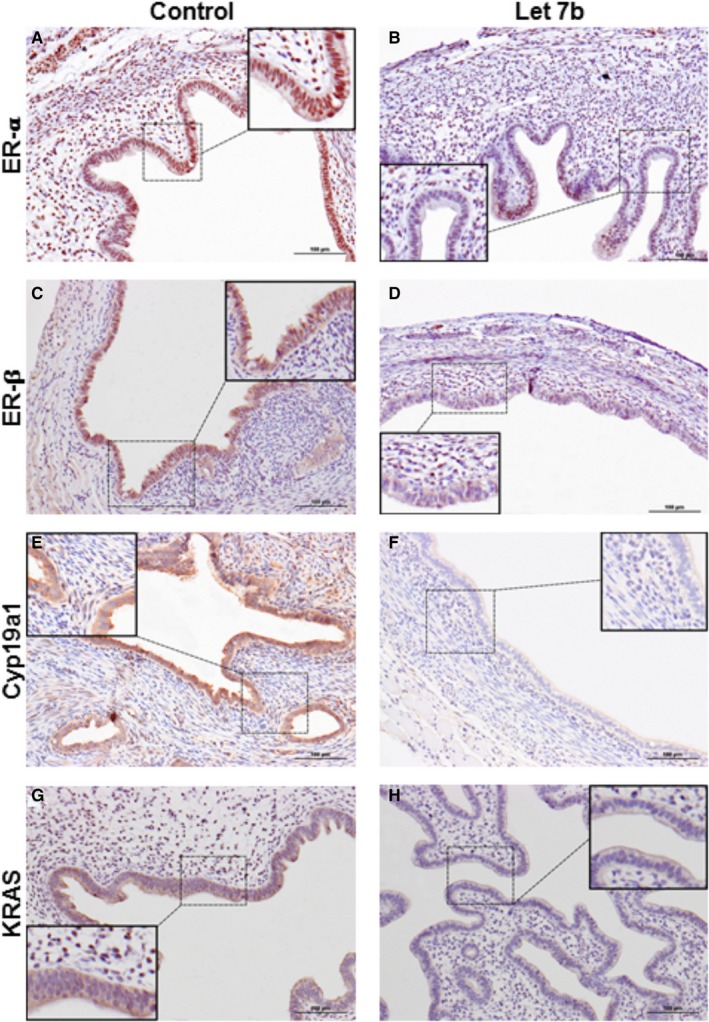
Representative images of protein levels of ER‐α, ER‐β and KRAS by immunohistochemical staining. ER‐α protein (A,B), ER‐β protein (C,D), and Cyp19a protein (E,F) and KRAS protein (G,H). Protein levels were significantly decreased in microRNA Let‐7b treated group compared to the control group. Additional panels in each image show the higher magnification of the immunohistochemical staining that shows the nuclear and/or cytoplasmic localization of the respective protein. (magnification, ×20, Scale bar = 100 μm)