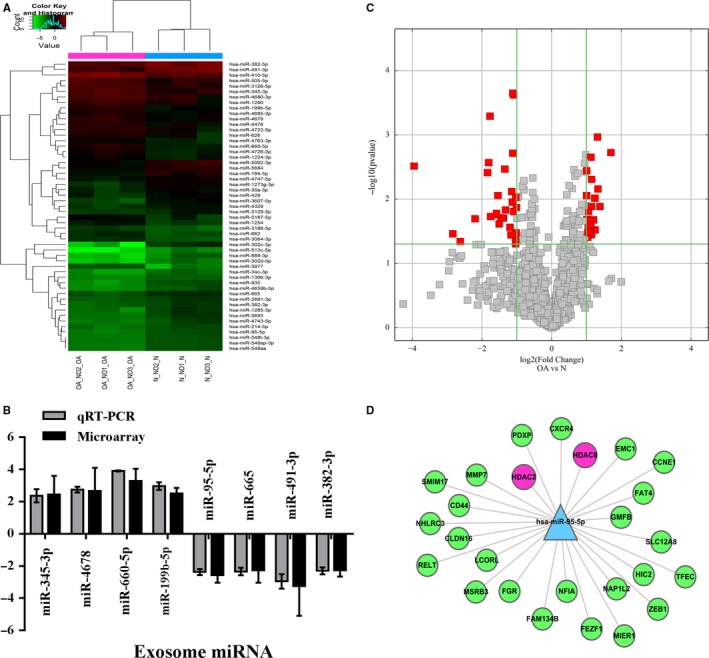
Figure 2.

Exosomal miRNA expression profiles in chondrocyte‐derived exosomes. A, Hierarchical Clustering shows a distinguishable exosomal miRNA expression profile between the two groups and homogeneity within groups. RNA was extracted from chondrocytes‐derived exosomes samples obtained from three OA patients and three control subjects. B, qRT‐PCR confirmation of miRNA expression in OA chondrocyte‐secreted exosomes and normal chondrocyte‐secreted exosomes. Quantitative real‐time PCR was performed with indicated primers and fold‐change of mRNA was normalized to U6 mRNA. Samples from three OA or normal chondrocytes and each were repeated three times. C, Volcano Plot of the differentially expressed exosomal miRNA. The red points in the plot represent the differentially expressed exosomal miRNA with statistical significance. D, Some of target gene of miR‐95‐5p, which can directly target HDAC2 and HDAC8
