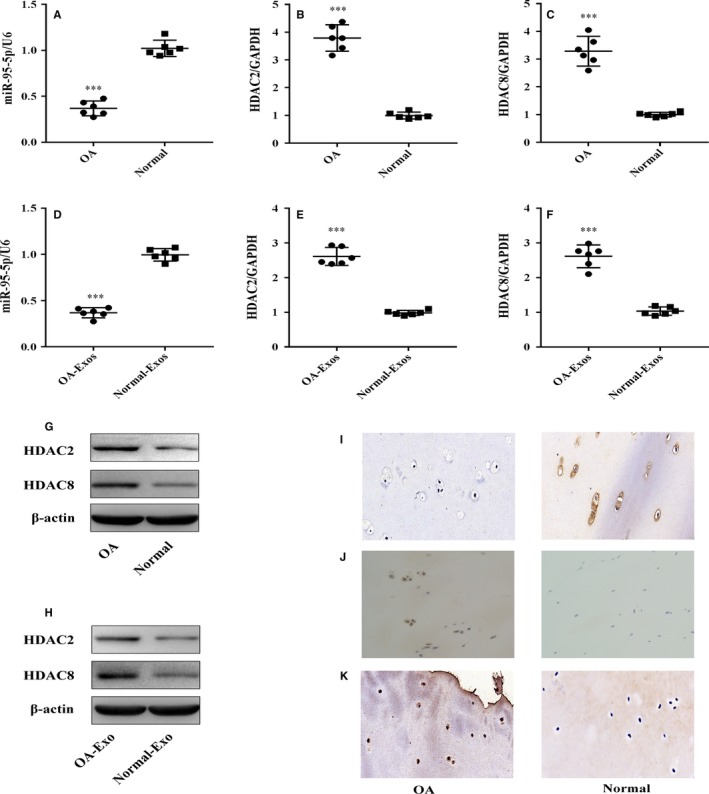
Figure 3.

The expression of mature miR‐95‐5p and HDAC2/8 in normal and OA cartilage. A‐C, Relative miR‐95‐5p and HDAC2/8 mRNA levels in normal and OA cartilage tissues and (D‐F) in normal and OA cartilage‐secreted exosome were determined by SYBR green‐based qRT‐PCR. U6 and GAPDH were used as endogenous controls. Each dot represents a value from a single experiment of one donor. The bar shows the mean and 95% confidence intervals of the values from six different donors per group. ***P < 0.001. G, H, J, K, HDAC2/8 protein levels in normal cartilage and OA tissues or cartilage‐secreted exosomes were determined by Western blotting and immunohistochemistry using anti‐HDAC2/HDAC8 monoclonal antibody and β‐actin as endogenous controls. Data shown are representative of results from six normal and OA cartilages (magnification, ×200). I, The miR‐95‐5p expression levels were determined in normal cartilage and OA cartilage by in situ hybridization (magnification, ×200). Scale bar 50 μm
