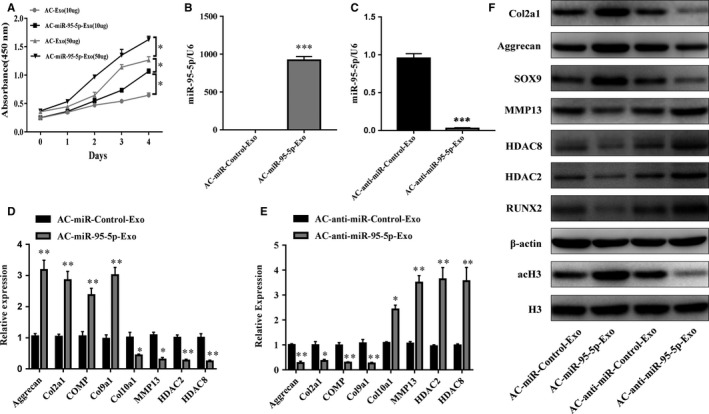
Figure 4.

Responses of articular chondrocytes to stimulation by AC‐ miR‐95‐5p‐Exos. A, AC‐Exos and ACmiR‐95‐5p‐Exos co‐cultured with chondrocytes at different doses. B, C, Expression level changes of miR‐95‐5p in AC‐miR‐Control‐Exos and AC‐miR‐95‐5p‐Exos, or AC‐anti‐miR‐Control‐Exos and AC‐anti‐miR‐95‐5p‐Exos were determined by SYBR green‐based qRT‐PCR. U6 was used as endogenous controls. Chondrocytes were treated with AC‐miR‐Control‐Exos and AC‐miR‐95‐5p‐Exos or AC‐anti‐miR‐Control‐Exos and AC‐antimiR‐95‐5p‐Exos. D, E, The gene expression levels of aggrecan, Col2a1, Col9a1, COMP, Col10a1, MMP13, HDAC2 and HDAC8 were estimated by qRT‐PCR. Quantitative data are presented as means ± standard deviations from three independent experiments. GAPDH was used as internal controls for mRNA. *P < 0.05, **P < 0.01, ***P < 0.001. F, The acetylation level of histone H3 and expression levels of aggrecan, Col2a1, SOX9, RUNX2, MMP13, HDAC2 and HDAC8 were visualized by Western blotting and β‐actin and total histone H3 were internal controls as endogenous control
