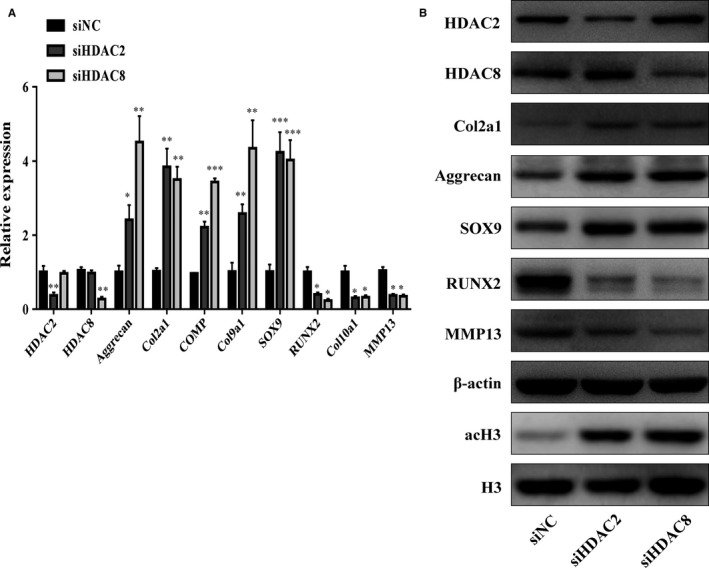
Figure 6.

PHCs were transfected with siNC (as control) or siHDAC2/8. The gene expression levels of aggrecan, Col2a1, COMP, Col9a1, Col10a1, SOX9, RUNX2, MMP13, HDAC2 and HDAC8 were estimated by qRT‐PCR (A). Quantitative data are presented as means ± standard deviations from three independent experiments. GAPDH was used as internal controls for mRNA, *P < 0.05, **P < 0.01, ***P < 0.001. The acetylation of histone H3 and expression of HDAC2, HDAC8, SOX9, RUNX2, MMP13, Col2a1 and aggrecan were visualized by Western blot and β‐actin and total histone H3 were internal controls as endogenous control
