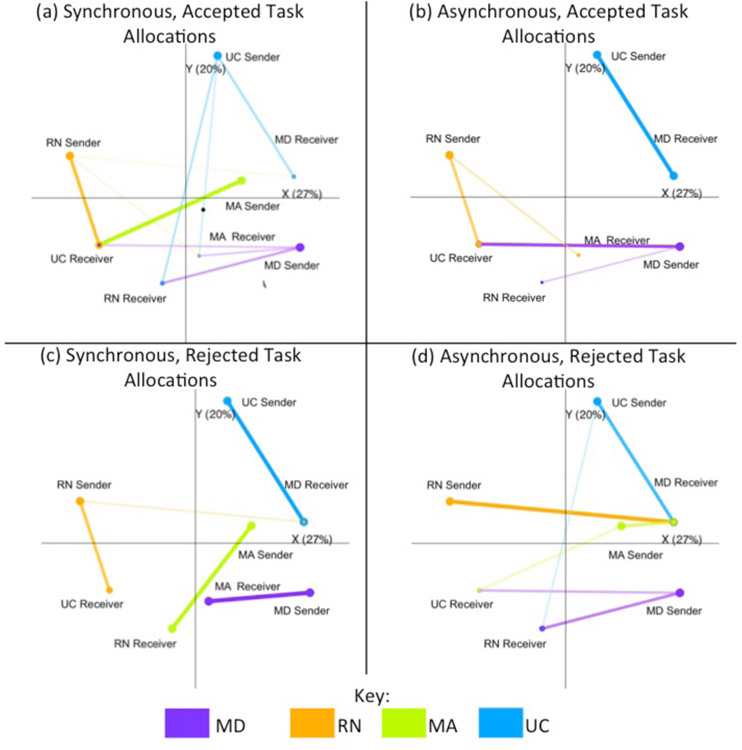
Figure 2.
ENA communication networks.
Note: Abbreviations in this figure are MD for physician, RN for nurse and UC for unit clerk. Line color and sender node indicate the sender role; receiver node indicates the receiving role. Line thickness and darkness indicates connection strength, i.e. relative frequency of accepted task assignments from that sender to that receiver. Node size indicates frequency the role is a sender or receiver, respectively.

