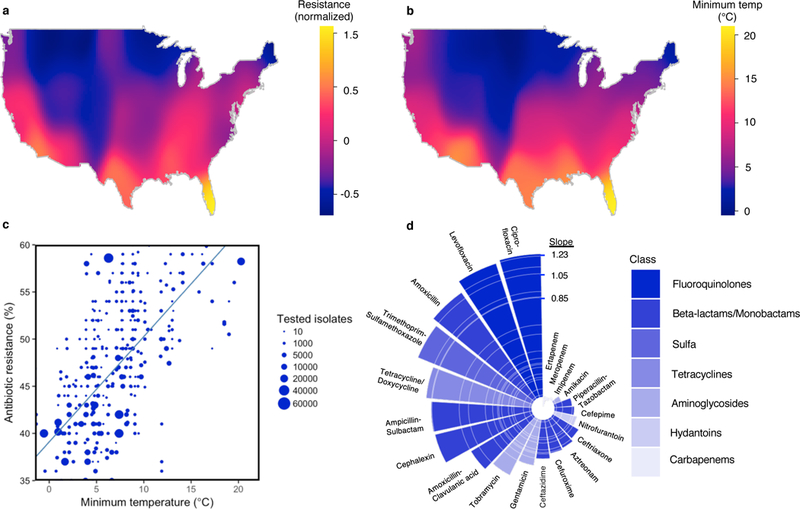
Figure 1. Antibiotic resistance increases with increasing temperature.

(A) A heatmap of mean normalized antibiotic resistance for E. coli for all antibiotics across the United States. (B) A heatmap of 30-year average minimum temperature (°C) across the United States. (C) A scatter plot of antibiotic resistance versus minimum temperature (°C) by acquisition type for E. coli and amoxicillin. Unadjusted weighted linear trend line is shown in blue. (D) Slope of unadjusted relationship (% Resistance/°C) between minimum temperature and antibiotic resistance by antibiotic for E. coli. Antibiotic class coded by color shading.
