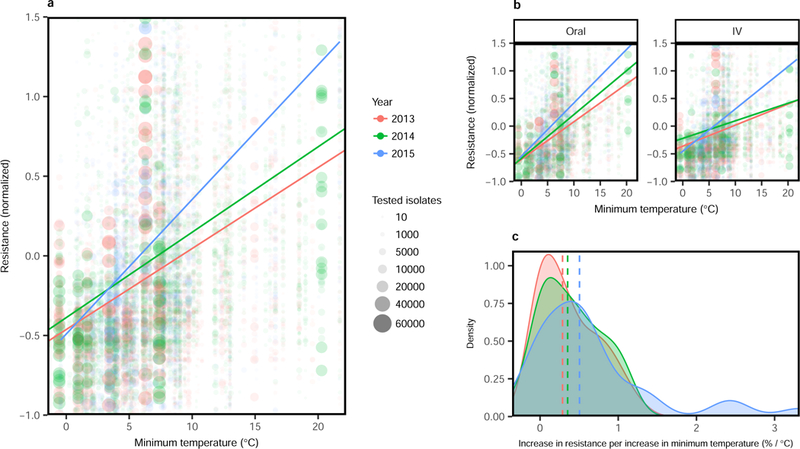
Figure 2. Change in the relationship between minimum temperature and antibiotic resistance over time.

(A) Mean normalized antibiotic resistance versus minimum temperature (°C) for all pathogens and antibiotics, stratified by year (2013–2015). Unadjusted weighted linear relationships for years 2013–2015 are shown. (B) Mean normalized antibiotic resistance versus minimum temperature (°C) for all pathogens and antibiotics, stratified by year and route (oral versus IV). (C) Density distributions of association measures (slopes) between antibiotic resistance and minimum temperature, stratified by time and with median densities (by year) marked by vertical dashed lines
