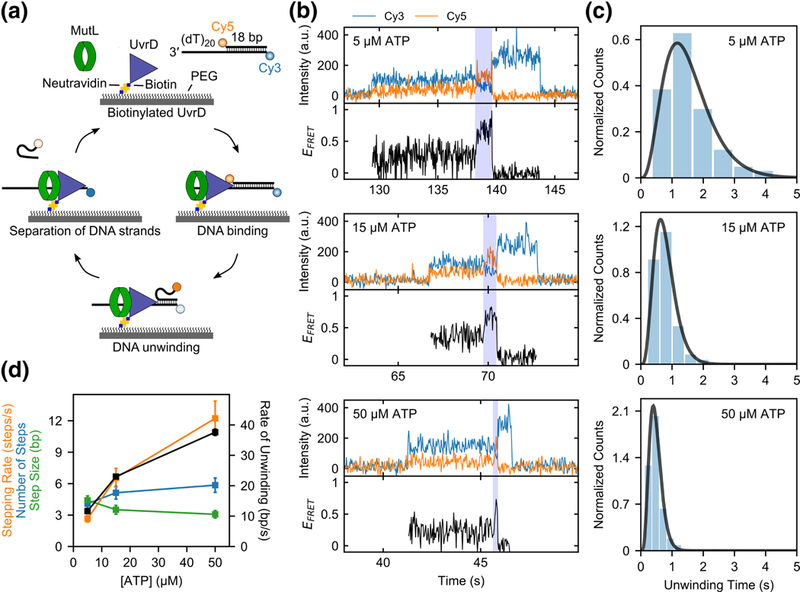
Fig. 1. Activation of UvrD monomer helicase by MutL.

a, Cartoon showing the steps in a single molecule DNA unwinding event. b, Examples of single molecule time traces for UvrD monomer unwinding of 1 nM DNA in the presence of 50 nM MutL dimer at varying ATP concentrations (5 μM, 15 μM, and 50 μM) in imaging buffer at 25 °C. c, Histograms of the DNA unwinding time durations and the best fits (black lines) to a gamma distribution (see Eq. 1) at three ATP concentrations (5 μM, 15 μM, and 50 μM). d, Best fit values of the DNA unwinding parameters with standard errors shown as error bars.
