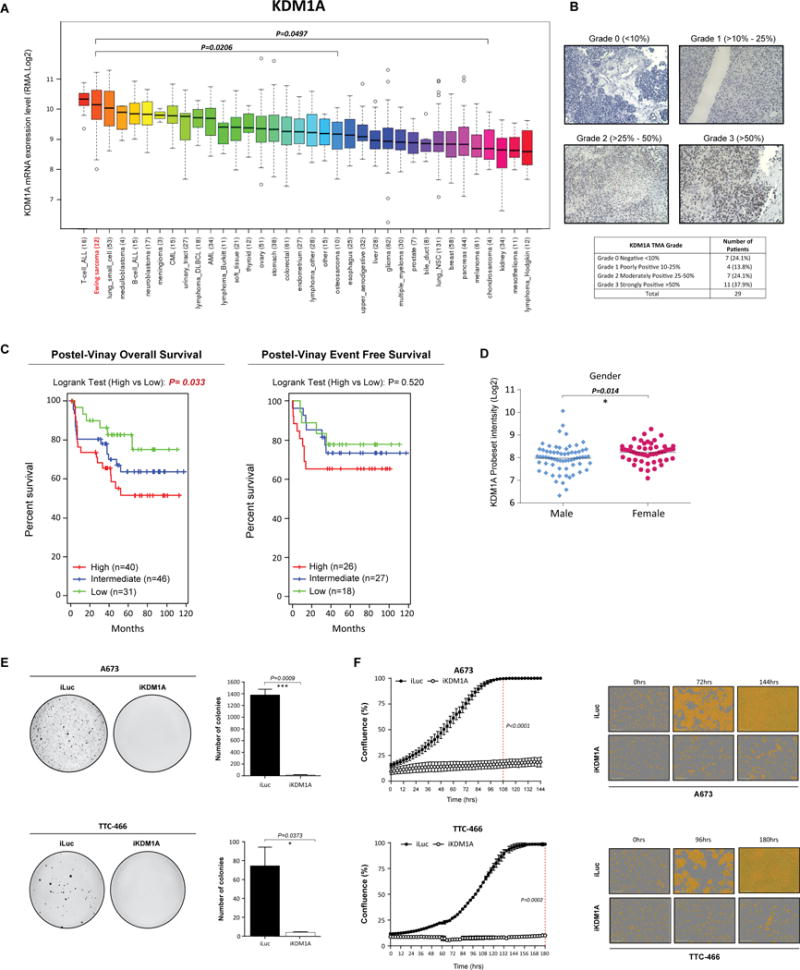
Fig. 1. KDM1A is highly expressed in Ewing sarcoma cell lines and tumors.

(A) BROAD Institute Cancer Cell line expression data of KDM1A across 36 distinct cancer entities. (B) Representative immuno-histochemical analysis of KDM1A in Ewing sarcoma patient tumors. (C) Event free and overall survival of Ewing sarcoma patients stratified by high (median +0.5xMAD), intermediate and low (median -0.5xMAD) KDM1A expression. Expression data obtained from Postel-Vinay et al., 2012. (D) Correlation between KDM1A expression and patient gender. Expression data obtained as described in (D). Log-rank (Mantel Cox Test) used to determine survival significance. (E) Representative images and quantification of soft agar colonies of A673 and TTC-466 cells stably transduced with iKDM1A or iLuc control shRNA constructs following Puromycin selection. (F) Real-time live cell imaging (IncuCyte ZOOM) of A673 and TTC-466 cells transduced with iKDM1A or iLuc shRNA constructs. Cell proliferation measured for 144 and 180hrs respectively. Dashed line represents 100% confluency (iLuc). Representative phase contrast images are also depicted. Data represents mean ± SEM from three independent experiments for A673 cells and mean ± STDEV from two independent experiments for TTC-466 cells. Asterisks denote statistical significance (*P<0.05, ***P <0.001).
