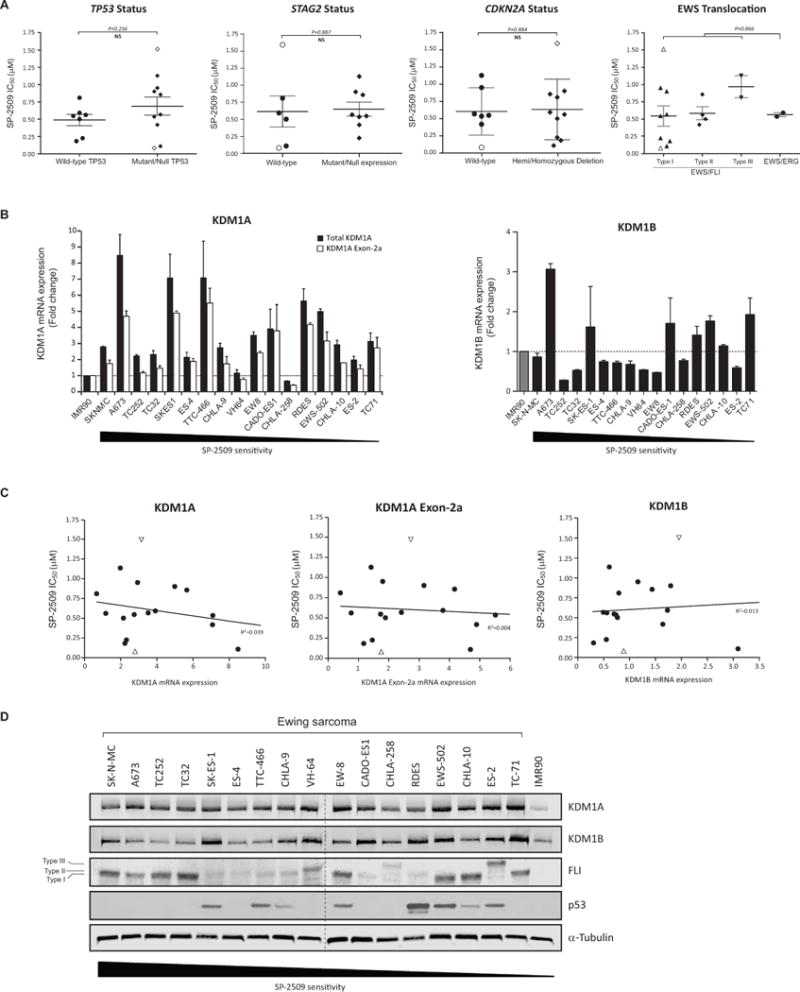
Fig. 3. Basal KDM1A mRNA and protein levels do mediate SP-2509 sensitivity in Ewing sarcoma.

(A) Lack of correlation between TP53/STAG2/CDKN2A status, EWS/ETS translocation partner and SP-2509 sensitivity (IC50). (B) Relative mRNA expression (fold change) of KDM1A, KMD1A Exon-2a and KDM1B in the Ewing sarcoma cell line cohort. Expression normalized to IMR90 cells. Data represents mean mRNA expression ± STDEV from two independent experiments. (C) Lack of correlation between KDM1A, KMD1A Exon-2a and KDM1B mRNA expression levels and SP-2509 sensitivity (IC50). (D) Western blot analysis of KDM1A, KDM1B, FLI and TP53 protein expression in the cell line cohort. Cell lines are ranked in order of SP-2509 sensitivity (IC50). Data represents mean SP-2509 IC50 ± SEM from three independent experiments. Open symbols denote most (SK-N-MC) and least (TC-71) SP-2509 sensitive cell lines.
