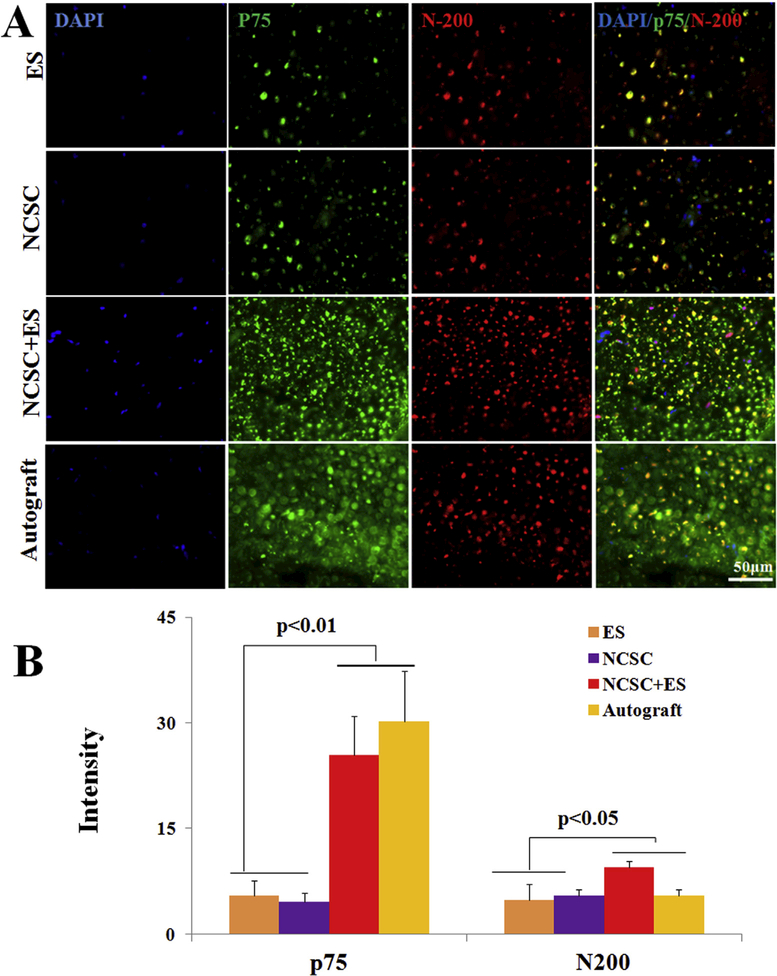
Fig. 4.
Representative cross-sectional immunofluorescence images after 12 weeks recovery, (A) the middle section of the nerve conduit was stained with DAPI (blue), p75 (green), and N-200 (red), scale bar = 50 μm; (B) comparison of the fluorescent intensity of p75 and N200, data are expressed as means ± SEM. N = 6 for each group. (For interpretation of the references to colour in this figure legend, the reader is referred to the Web version of this article.)

