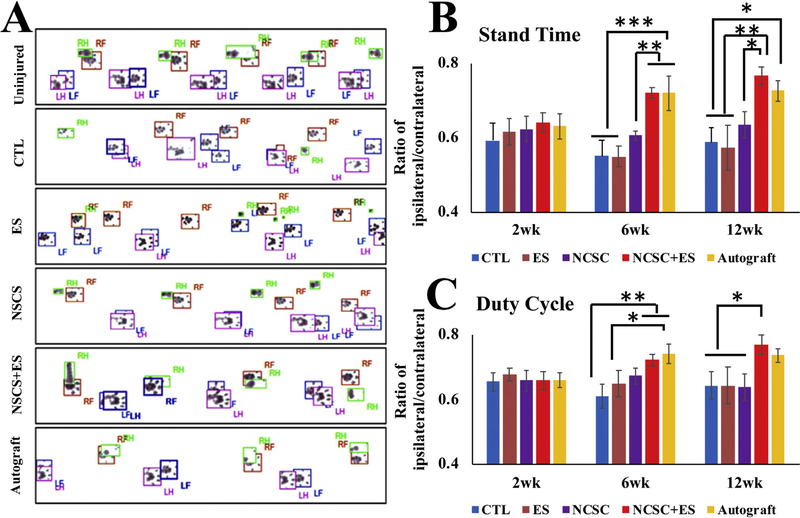
Fig. 8.
(A) representative footprints measured by the Catwalk system after 12 weeks injury, RF = right forepaw, LF = left forepaw, RH = right hindpaw, and LH = left hindpaw. Comparison of locomotion changes between groups over time after nerve repair in (B) Stand Time and (C) Duty Cycle. Neural crest stem cell (NCSC) + electrical stimulation (ES) showed significant improvements over NCSC, ES, and control groups at 12 weeks for both metrics, and at 6 weeks for stand time (all p < 0.05). NCSC + ES showed no significant difference from autograft for both metrics at all time points. Data presented as Mean ± SEM. ***p ≤ 0.001, **p ≤ 0.01, *p ≤ 0.05.

