
Figure 3.
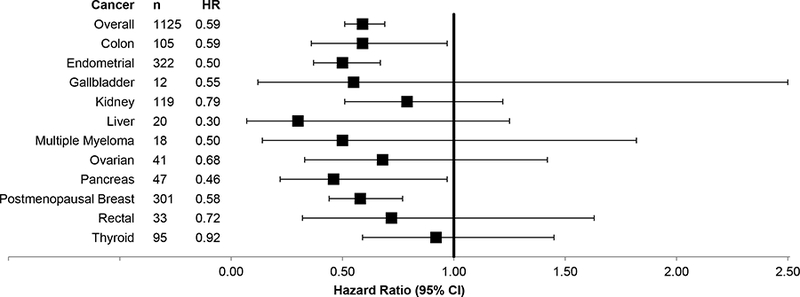
Forest Plot of Multivariable Cox Proportional Hazards models for Obesity-Associated Cancers. The box represents the hazard ratio and the error bars depict the 95% confidence interval. Matching occurred on age, sex, BMI, Elixhauser comorbidity index score and study site. The models are adjusted for race, diabetes, hyperlipidemia, hypertension, coronary artery disease, peripheral vascular disease, nonalcoholic steatohepatitis, a history of smoking, alcohol use, and use of hormone replacement therapy.