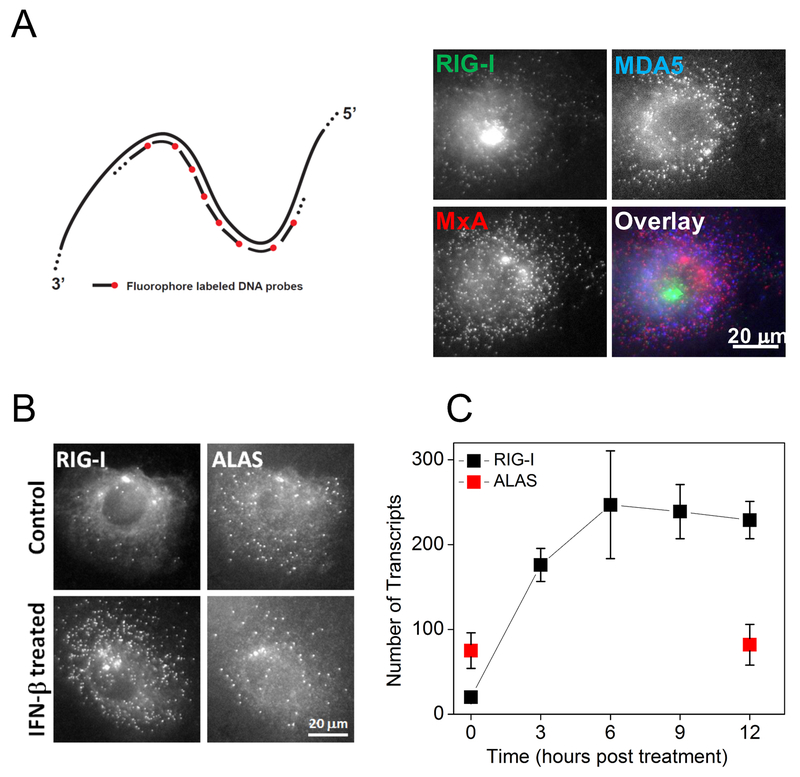
Figure 1. Quantification of IFN induced gene expression in single HepG2 cells.
(A) The schematics of single-molecule fluorescence in-situ hybridization (smFISH) and simultaneous imaging of RIG-I, MXA, and MDA5 mRNA in individual HepG2 cells treated with IFN-β for 6 hours. (B) Images of RIG-I and housekeeping gene ALAS mRNA in control and IFN-β treated (6 hours) HepG2 cells. (C) Kinetics of RIG-I mRNA expression post IFN-β treatment. Transcript numbers (mean ± SD) are obtained from 10 to 20 cells at each time point.

