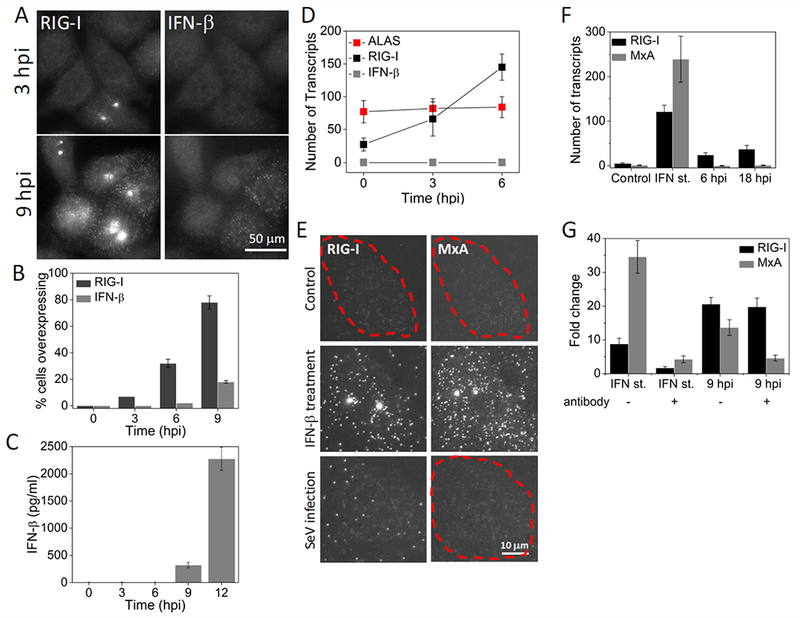
Figure 2. RIG-I is induced IFN-independently at the early stages of Sendai virus infection.

(A) Images of RIG-I and IFNB1 mRNA in HepG2 cells at 3 and 9 hours post SeV infection. (B) Percentage (mean ± SD) of HepG2 cells overexpressing RIG-I and IFNB1 mRNA as a function of time post SeV infection. 600 to 1000 cells were analyzed at each time point. (C) ELISA to detect IFN-β (mean ± SD) in the culture medium at different time points after SeV infection. Data is obtained from three independent experiments. (D) Number of RIG-I, IFNB1 and ALAS transcripts per cell (mean ± SD) in SeV infected (3 and 6 hours) HepG2 cells. Transcript numbers are obtained from 50 cells that overexpress RIG-I at each time point. (E) Images of RIG-I and MXA mRNA in control, IFN-β treated (12 hours) or SeV infected (18 hours) Vero cells. Cell borders are denoted by dashed outlines. (F) Number of RIG-I and MXA mRNA per 25 cell (mean ± SD) in control, IFN-β treated (12 hours) or SeV infected (6 and 18 hours) Vero cells. 20 cells are analyzed at each condition. (G) qRT-PCR analysis of RIG-I and MXA mRNA in IFN-β treated (2 hours) or SeV infected (9 hours) HepG2 cells in the presence or absence of neutralizing antibodies against IFN-α, IFN-β, IFN-γ, and IFNAR. Results are normalized to GAPDH, and presented as fold change relative to control cells. Error bars show standard deviation of two independent experiments.
