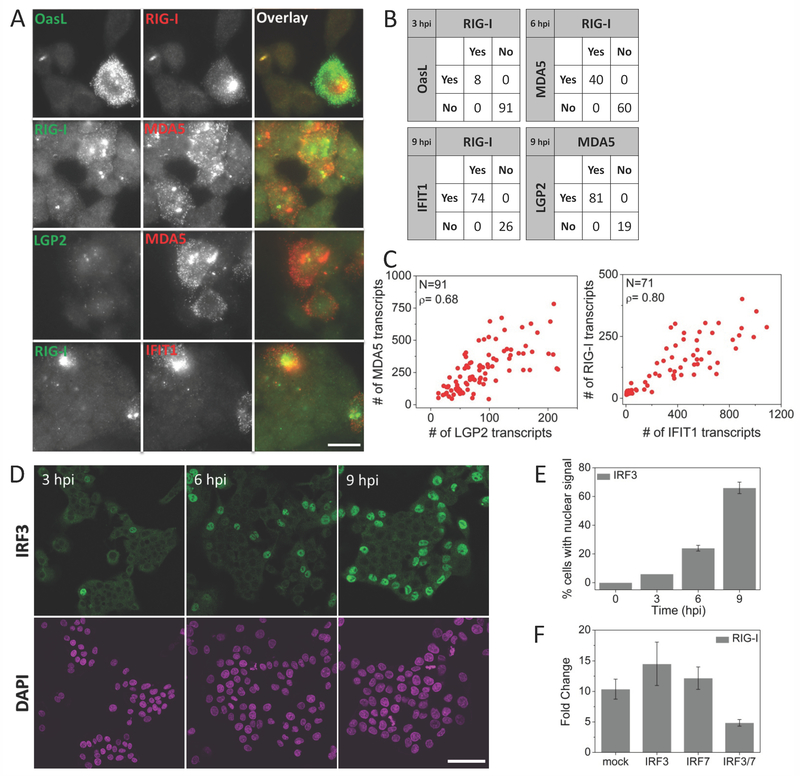
Figure 3. Virus-induced IFN-independent expression of early ISGs is strongly correlated and is dependent on IRF3/IRF7.
(A) Pairwise images of RIG-I and OASL, RIG-I and MDA5, LGP2 and MDA5, and RIG-I and IFIT1 transcripts in SeV infected HepG2 cells. Scale bar: 50 µm (B) Percentage of cells expressing RIG-I and/or OASL, RIG-I and/or MDA5, MDA5 and/or LGP2, and RIG-I and/or IFIT1 at indicated times post SeV infection. 200-300 cells were analyzed for each case. (C) Scatter plots of number of MDA5 vs. LGP2, and RIG-I vs. IFIT1 transcripts in single HepG2 cells at 9 hours post SeV infection. N: Number of cells analyzed, ρ: Pearson’s correlation coefficient. (D) Images of immunofluorescently labeled IRF3 at various time points post SeV infection. Scale bar: 50 µm (E) Percentage of cells (mean ± SD) displaying nuclear IRF3 as a function of time post SeV infection. 450 to 600 cells were analyzed at each time point. (F) qRT-PCR analysis of RIG-I mRNA in SeV infected (9 hours) HepG2 cells with prior siRNA knockdown (30 hours) of mock (HPRT1), IRF3, IRF7 and double knockdown of IRF3 and IRF7. Results are normalized to GAPDH, and presented as fold change relative to control cells. Error bars show standard deviation of two independent experiments.

