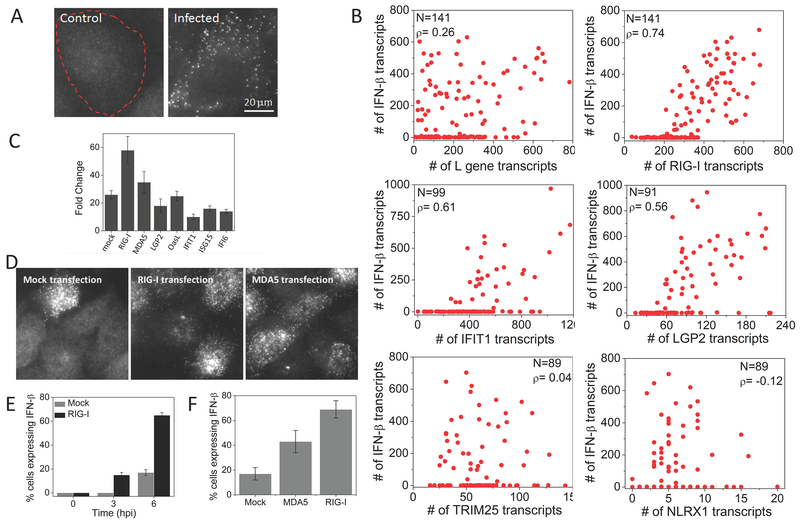
Figure 4. Early ISGs, but not viral L gene or other ISGs, are highly correlated with IFNB1 expression.
(A) Images of SeV L gene transcripts in control and SeV infected (6 hours) HepG2 cells. Cell border is denoted by dashed outline. (B) Scatter plots of number of L gene, RIG-I, IFIT1, LGP2, TRIM25, and NLRX1 against IFNB1 transcripts in single HepG2 cells at 9 hours post SeV infection. N: Number of cells analyzed, ρ: Pearson’s correlation coefficient. (C) qRT-PCR analysis of IFNB1 mRNA in SeV infected (9 hours) HepG2 cells with prior plasmid expression (12 hours) of mock, RIG-I, MDA5, LGP2, OASL, IFIT1, ISG15 and IFI6. Results are normalized to GAPDH, and presented as fold change relative to control cells. Error bars show standard deviation of two independent experiments. (D) Images of IFNB1 transcripts in HeLa cells 6 h post SeV infection with prior transfection of an empty vector, RIG-I or MDA5 (E) Percentage of HeLa cells (mean ± SD) expressing the IFNB1 gene at different time points post SeV infection, with prior transfection of an empty vector or RIG-I. (F) Percentage of HeLa cells (mean ± SD) expressing the IFNB1 gene at 6 hours post SeV infection, with prior transfection of an empty vector, RIG-I or MDA5.

