
Figure 1.
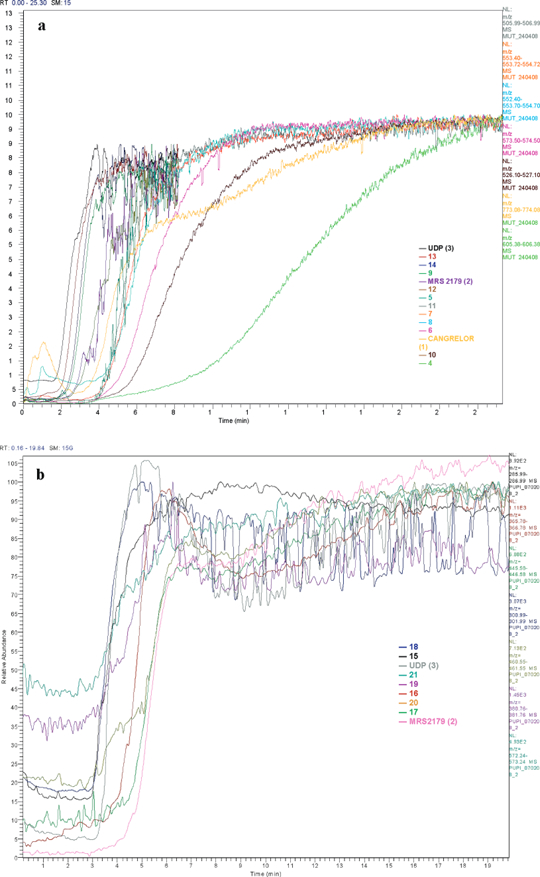
Frontal affinity chromatography—mass spectrometry of library A (a) and library B (b). Shown are extracted breakthrough curves for each analyte of library A and library B. Mixtures of ligands in the presence of the three reference compounds each at 1 fiM were infused through the GPR17-IAM-I column using the mass spectrometer in negative mode.