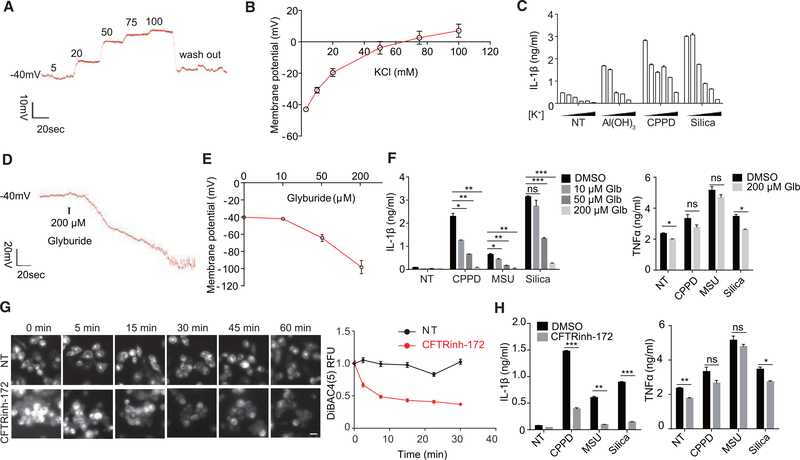
Figure 2. Depolarization or Hyperpolarization of Membrane Potential May Affect the Activation of NLRP3 Inflammasome.
(A) Representative membrane potential (MP) trace of a THP-1 macrophage treated with isotonically balanced salt solution containing different concentrations of K+ (mM) in whole-cell patch-clamp mode.
(B) THP-1 cell MP in response to different K+ concentrations (n = 5).
(C) THP-1 cells were treated with Al(OH)3, calcium pyrophosphate crystals (CPPD), or silica in different concentrations of extracellular K+ (5, 20, 50, 75, 100, and 130 mM, left to right). Supernatant was collected after 5 hr for IL-1β ELISA (n = 3).
(D) Representative MP trace of BMDCs treated with glyburide.
(E) BMDC MP in response to the indicated concentrations of glyburide (n = 5).
(F) ELISA analysis of IL-1β or TNF-α secreted by BMDCs stimulated with different crystals in the presence or absence of glyburide (Glb).
(G) THP-1 cells were stained with DiBAC4(5) to check the effect of CFTRinh-172 on MP. Representative images and relative fluorescence unit (RFU) plotting are shown. Each point was mean ± SEM of cells from at least 12 fields in 2 independent experiments. Scale bar, 20 μm.
(H) ELISA analysis of IL-1β and TNF-α secreted by BMDCs stimulated with different crystals in the presence or absence of CFTRinh-172.
Data are expressed as mean ± SEM (B, C, and E–H). Results are representative of at least of 3 independent experiments (C, F, and H; n = 3). See also Figures S2 and S7.

