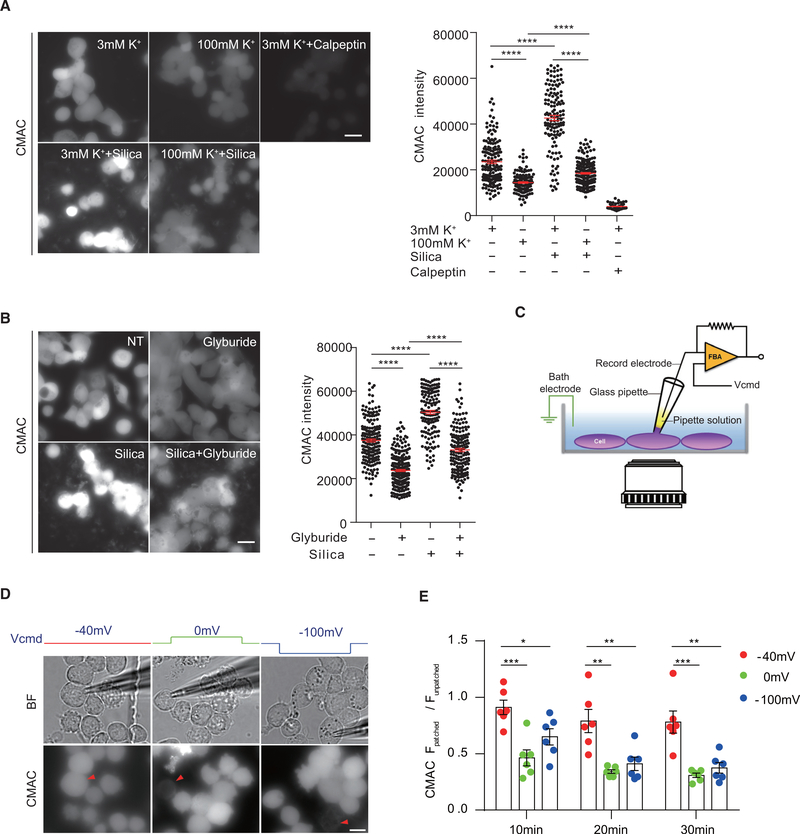
Figure 4. The Resting-State MP Must Be Maintained for Optimal Calpain Activation.
(A) Calpain activity in THP-1 cells treated with silica in the presence of different concentrations of extracellular K+ was measured using calpain fluorogenic substrate CMAC. Scale bar, 20 μm.
(B) Similar to (A), calpain activity in THP-1 cells under glyburide treatment or not was measured by CMAC.
(C–E) As shown in the schematic diagram (C), calpain activity in THP-1 cells, with MP values held at −40, 0, or −100 mV by patch clamping, was measured by CMAC. Representative pictures of calpain activity at 20 min are shown in (D). Red triangle, patched cell. Corresponding bright-field images are shown above. Scale bar, 10 μm. Statistical analysis (E) by dividing CMAC intensity of patched cell over other unpatched cells in the same field is shown. n = 6 for each condition. Results are a pool of 3 independent experiments (A and B). Error bars denote SEM. *p < 0.05, **p < 0.01, ***p < 0.001, ****p < 0.0001 (unpaired Student’s t test). See also Figure S4.

