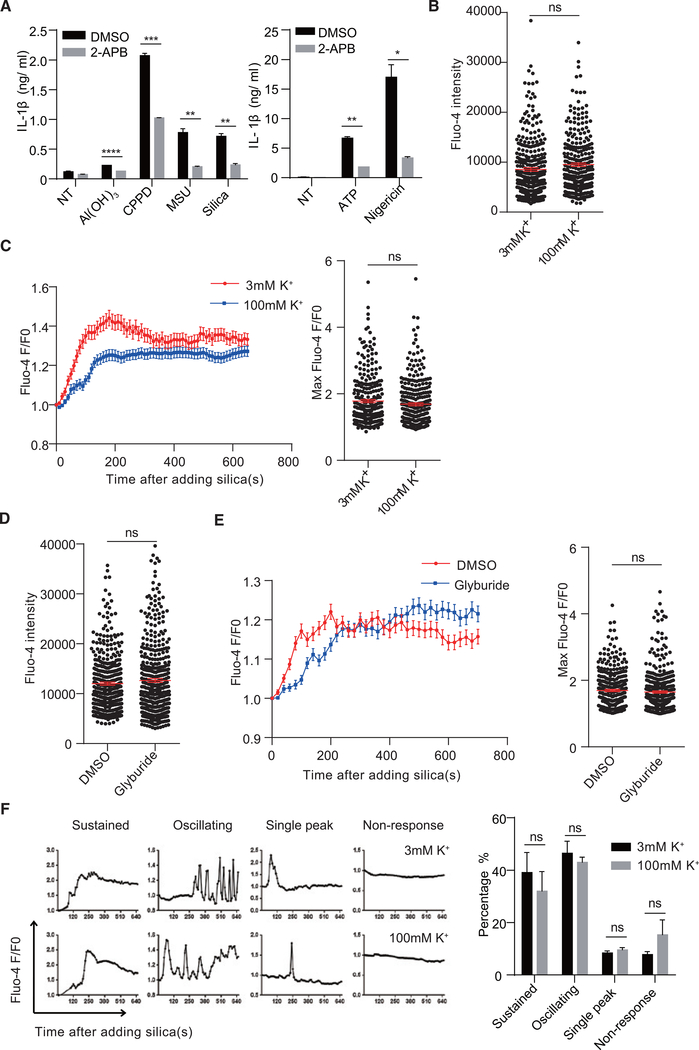
Figure 5. Disruption of MP Does Not Dramatically Affect Calcium Flux.
(A) BMDCs were pretreated with 50 μM 2-APB and activated with different crystals for 5 hr or ATP or nigericin for 1 hr. IL-1β in the supernatant was measured by ELISA (n = 3).
(B and C) THP-1 cells were stained with fluo-4 and medium was changed to 3 or 100 mM K+ buffer for 30 min. Ca2+ signals at basal level (B) or after silica stimulation over time (C, left) and at the maximum (C, right) were analyzed.
(D and E) THP-1 cells were stained with fluo-4 and then changed to medium with or without 200 μM glyburide for 30 min. Ca2+ signals at basal level (D) or after silica stimulation over time (E, left) and at the maximum (E, right) were analyzed.
(F) Pattern analysis of single-cell Ca2+ responses in (C) (sustained, maintaining high level for more than 3 min since induction; oscillating, with 2 or more oscillating peaks; single peak, one peak). Statistical analysis is shown on the right.
Error bars indicate SEM; ns, not significant (unpaired Student’s t test). Results are pooled from 3 independent experiments (B–F).

