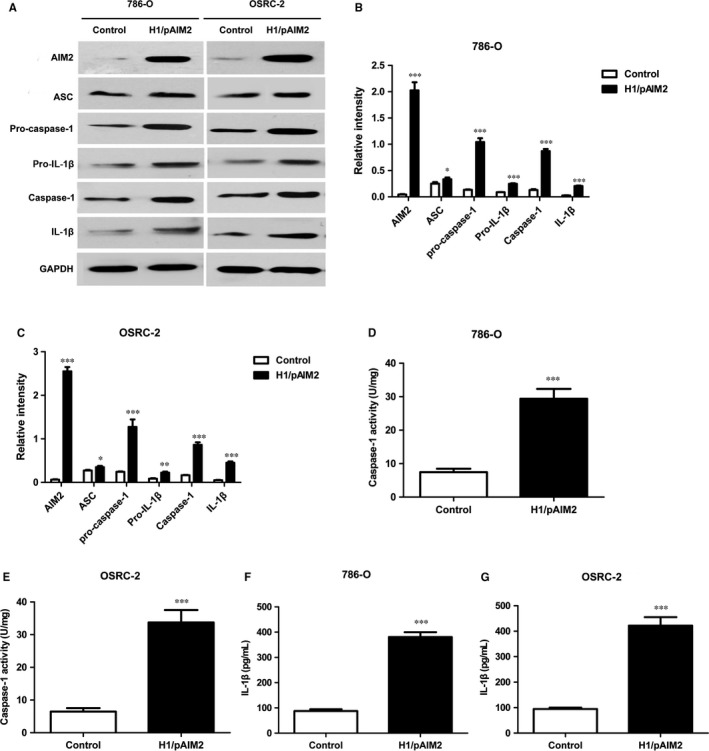
Figure 5.

H1/pAIM2 enhanced the activation of inflammasome in renal cancer cells. (A). The levels of AIM2, ASC, Pro‐caspase‐1, Pro‐IL‐β, Caspase‐1, IL‐1β were measured by Western blot in H1/AIM2 or control‐treated 786‐O or OSRC‐2 cell lines. (B and C). The statistical analysis of the band intensity represents the densitometric estimation of each band normalized by GAPDH in (A). (D and E). The levels of caspase‐1 were measured in H1/AIM2‐ or control‐treated 786‐O or OSRC‐2 cell lines. (F and G). The levels of IL‐1β were measured in treated renal cancer cell lines. Data are from one representative experiment of three performed and presented as the mean ± SD. The different significance was set at *P < 0.05, **P < 0.01 and ***P < 0.001
