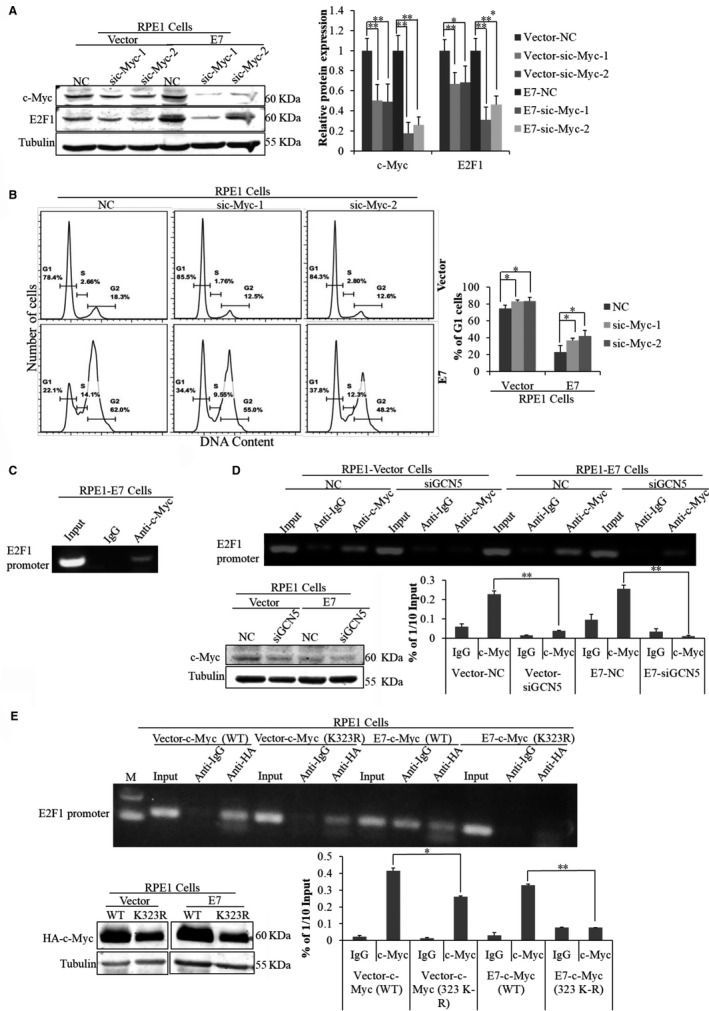
Figure 7.

The level of c‐Myc binding to E2F1 promoter was affected by GCN5. (A) The steady‐state levels of E2F1 and c‐Myc were measured by Western blot after treating cells with sic‐Myc for 24 h and additional 24 h with TSA treatment. (B) Flow cytometry of cells treated with bleomycin for 36 h after transfection with c‐Myc siRNA for 24 h and stained with PI. (C) ChIP assay was performed using c‐Myc antibody in cultured RPE1‐E7 cells. (D) ChIP assay was performed using c‐Myc antibody after transfection with siRNA targeting GCN5 for 48 h and Western blot analysis of the steady‐state level of c‐Myc. (E) Western blot analysis of c‐Myc after treating cells with plasmids c‐Myc (K323R). ChIP assay was performed using HA antibody after treating cells with plasmids c‐Myc (K323R). WT, wild‐type. Data from a representative experiment of 3 are shown, *P < 0.05; **P < 0.01
