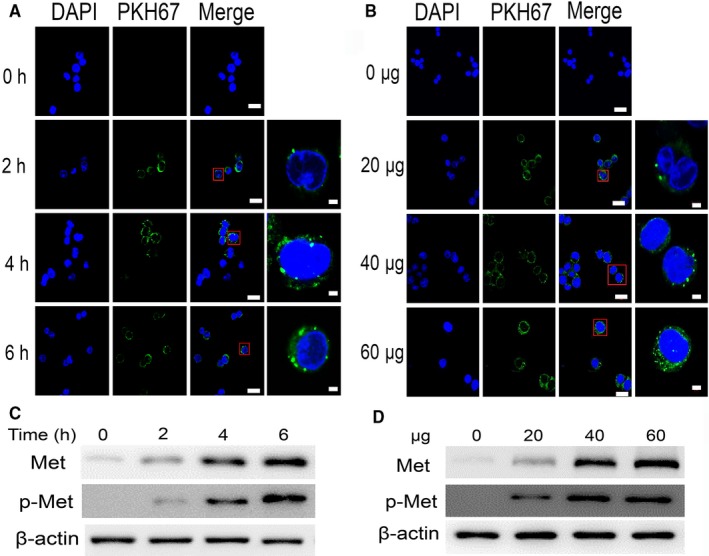
Figure 2.

Exosomal mesenchymal‐epithelial transition factor (MET) is delivered to macrophages. A, Confocal microscopy image showing the internalization of 40 μg of PKH67‐labelled exosomes in macrophages at different time‐points. Scale bars represent 20 μm. B, Confocal microscopy image showing the internalization of 0, 20, 40, or 60 μg of exosomes into macrophages after 6 h. Magnification: 630×, scale bars represent 20 μm. Magnified views were shown on the right. Scale bars represent 2 μm. C,D, Graphs showing the time‐ and concentration‐dependent nature of exosome‐mediated MET expression in macrophages
